|
Topographic Maps - USGS Maps - Reading
Topos
Reading a Topographic Map
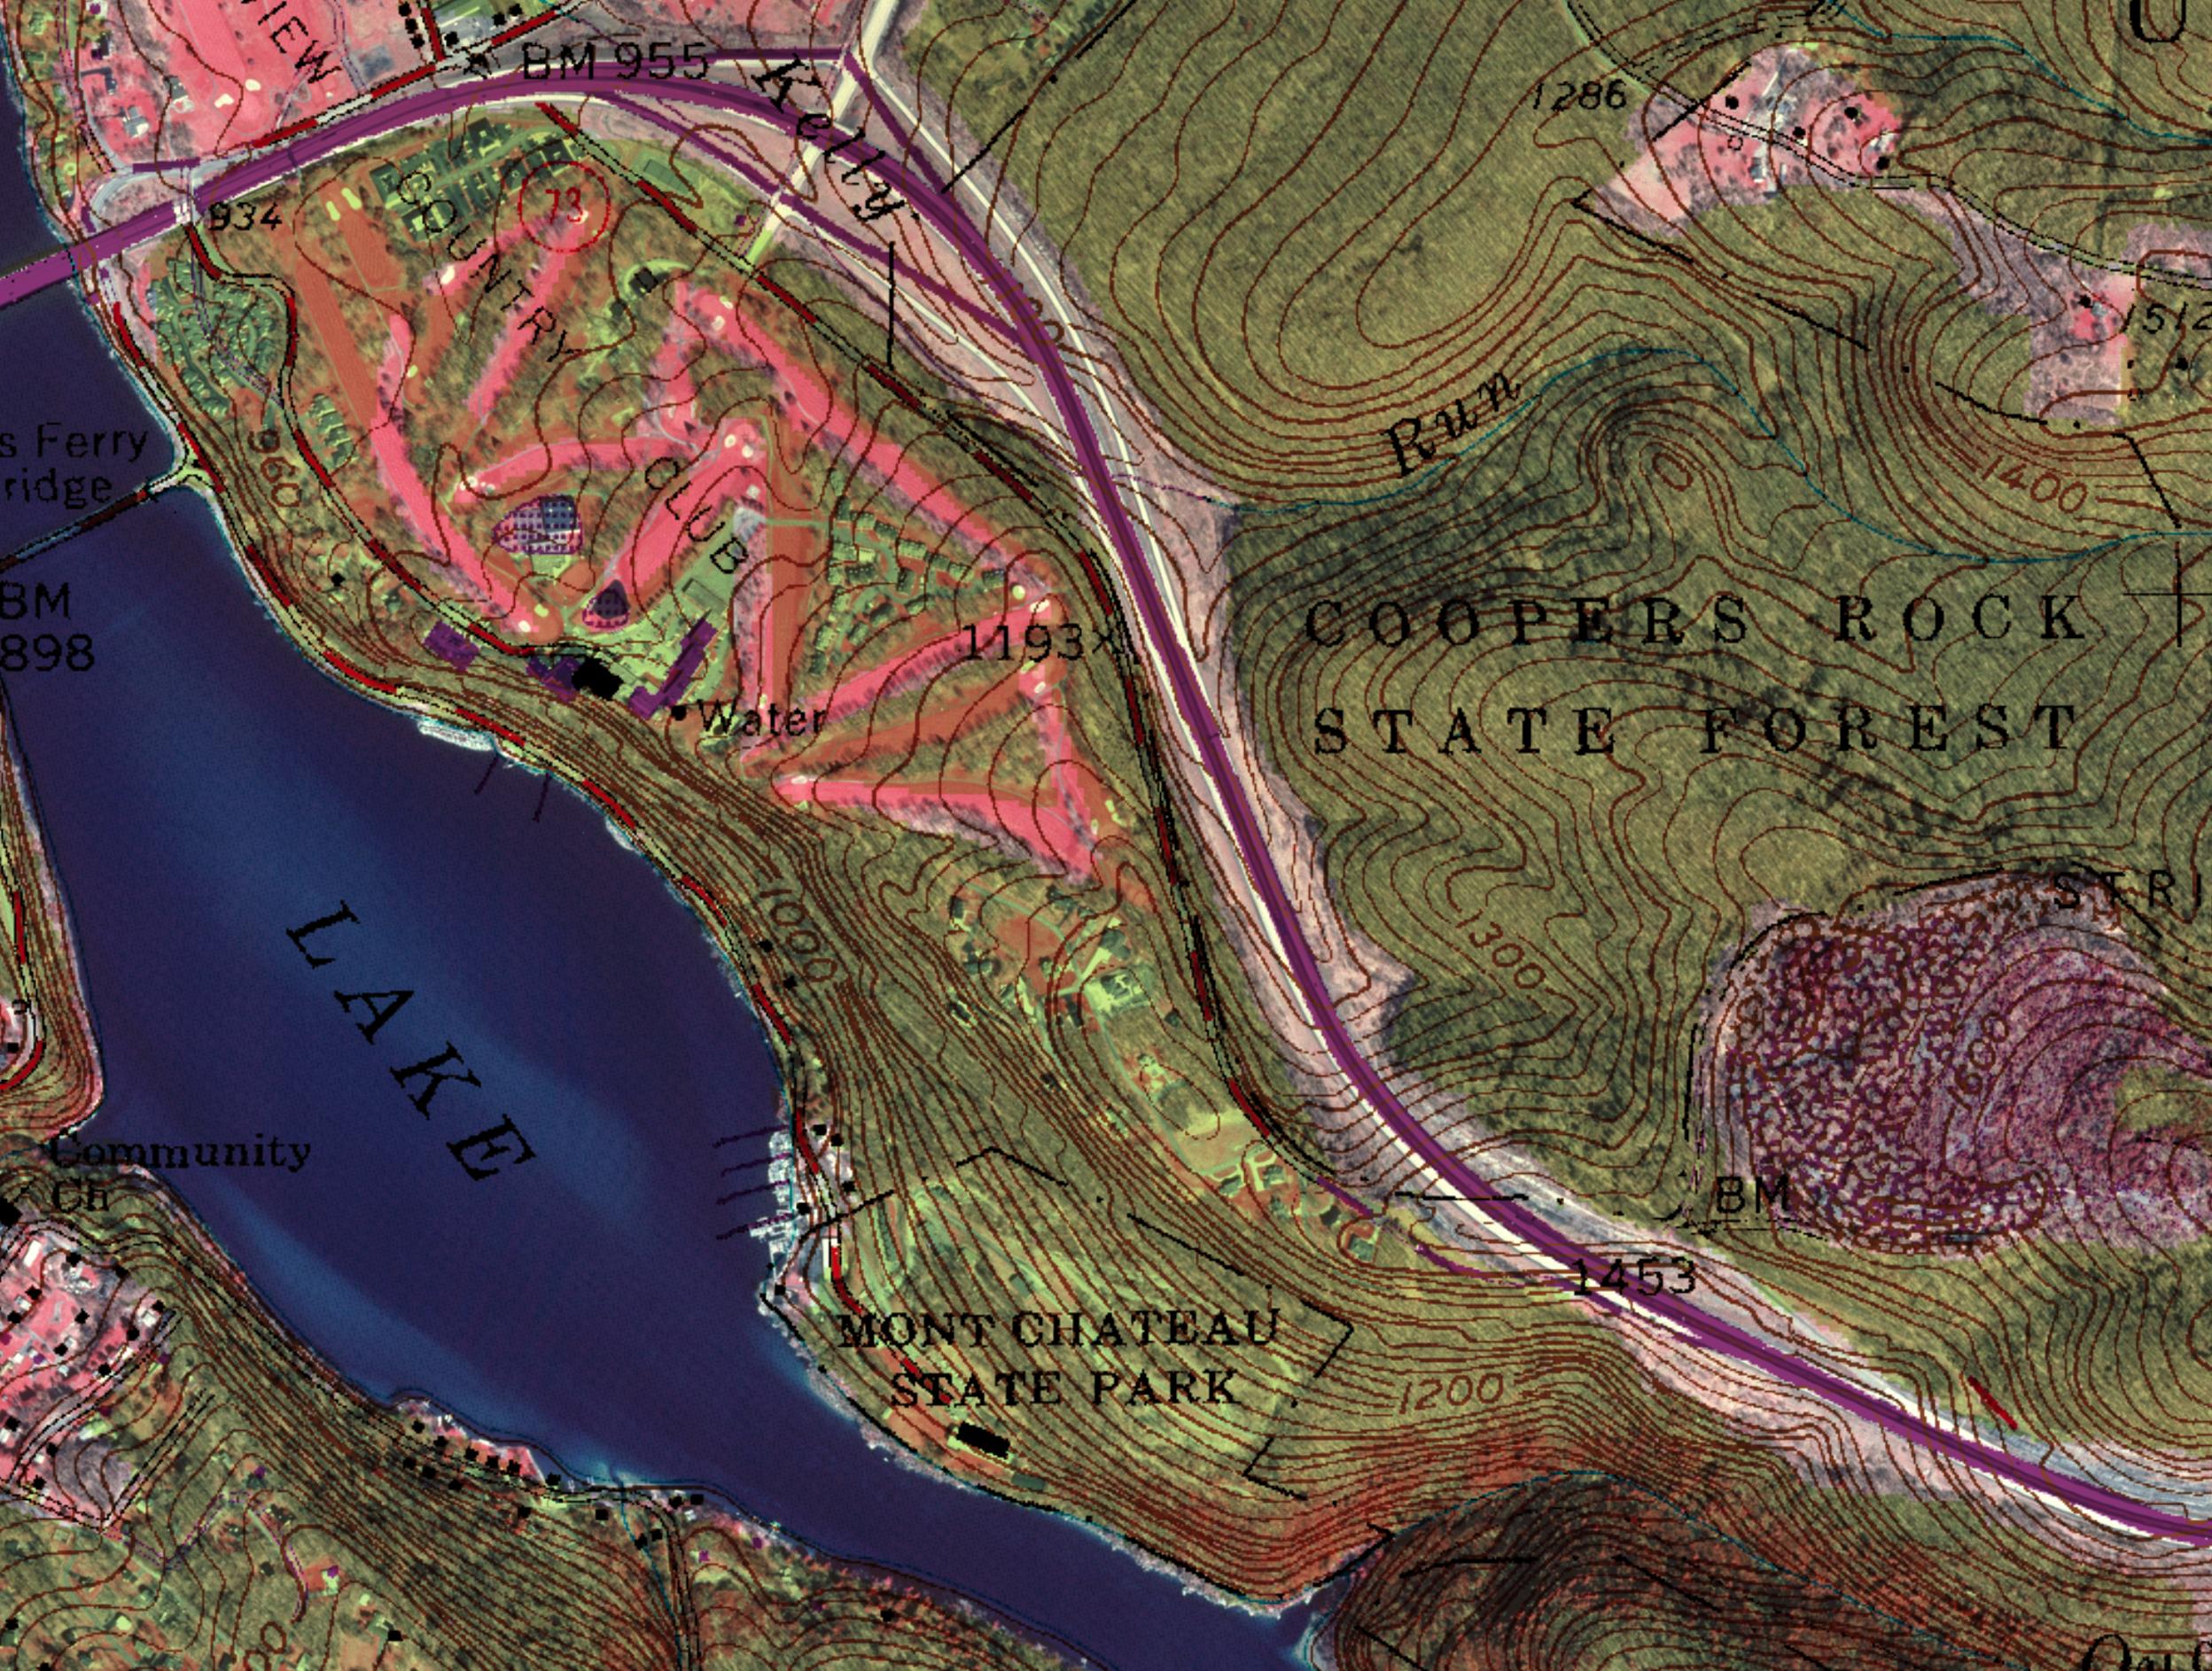
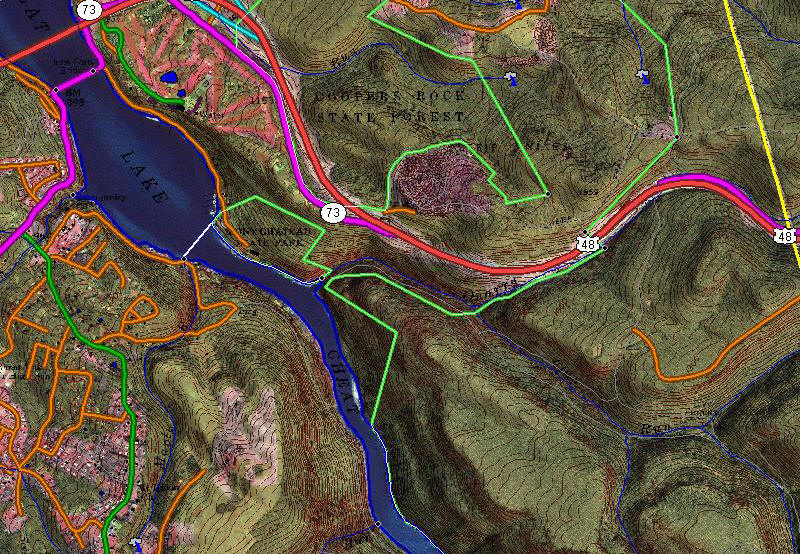
Interpreting the colored lines, areas, and other symbols is the
first step in using topographic maps. Features are shown as points,
lines, or areas, depending on their size and extent. For example,
individual houses may be shown as small black squares. For larger
buildings, the actual shapes are mapped. In densely built-up areas,
most individual buildings are omitted and an area tint is shown. On
some maps, post offices, churches, city halls and other landmark
buildings are shown within the tinted area.
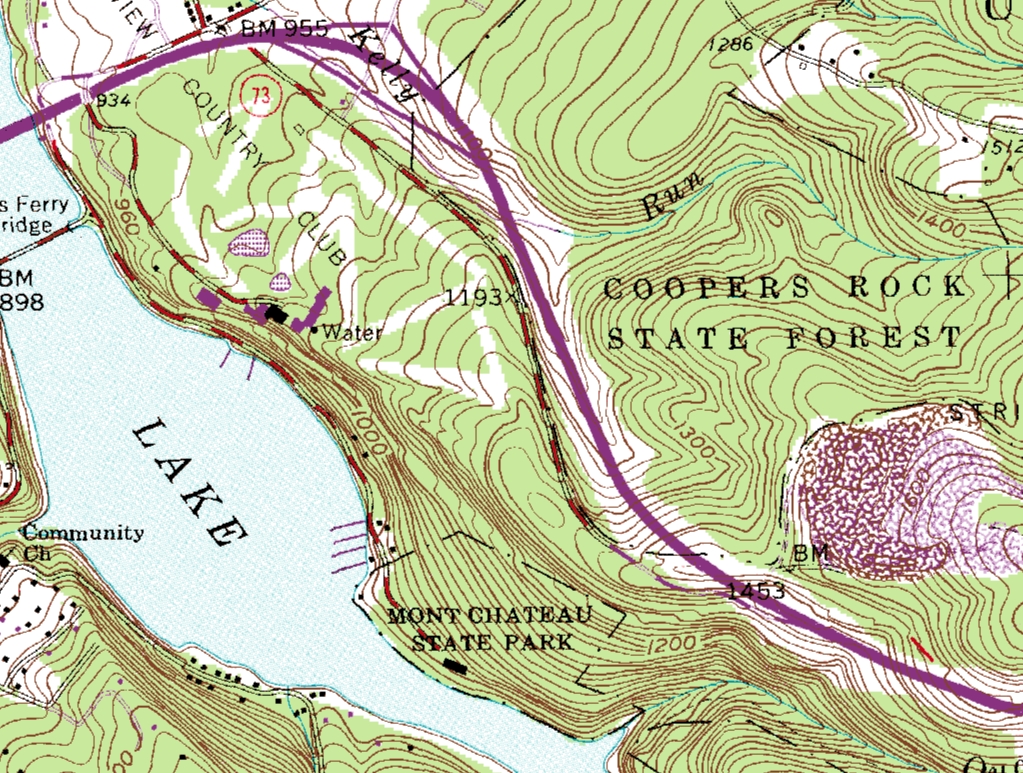
The first features usually noticed on a topographic map are the
area features such as vegetation (green), water (blue), some
information added during update (purple), and densely built-up areas
(gray or red).
Many features are shown by lines that may be straight, curved,
solid, dashed, dotted, or in any combination. The colors of the lines
usually indicate similar kinds or classes of information: brown for
topographic contours; blue for lakes, streams, irrigation ditches,
etc.; red for land grids and important roads; black for other roads
and trails, railroads, boundaries, etc.; and purple for features that
have been updated using aerial photography, but not field verified.
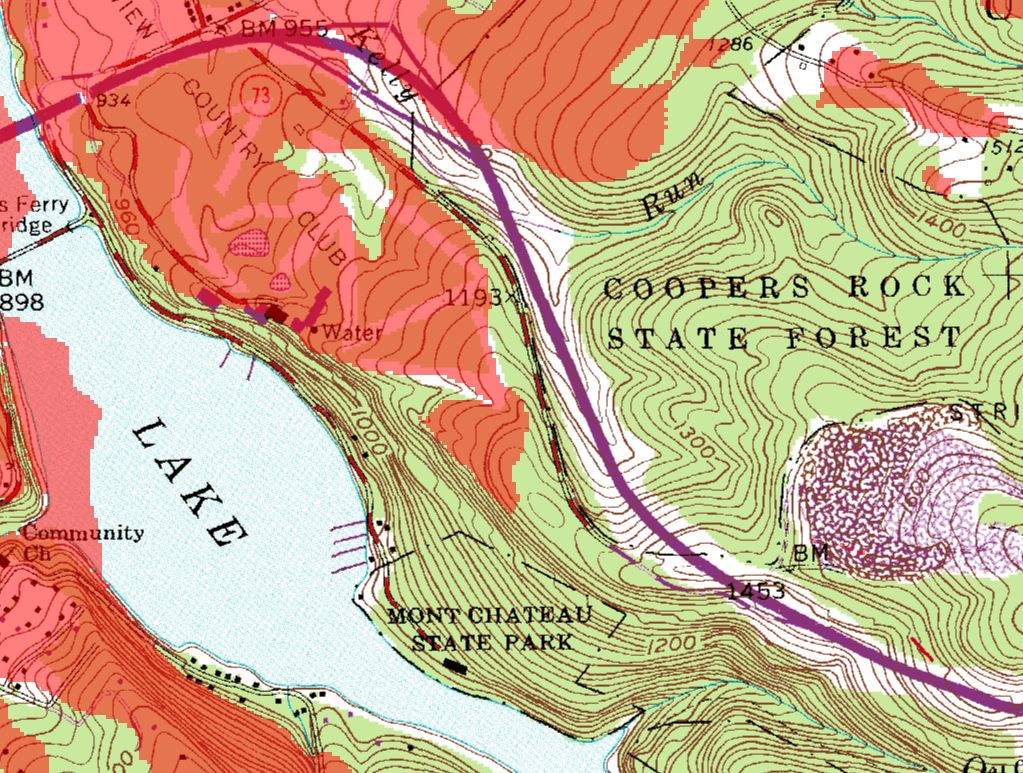
Various point symbols are used to depict features such as
buildings, campgrounds, springs, water tanks, mines, survey control
points, and wells.
Names of places and features also are shown in a color
corresponding to the type of feature. Many features are identified by
labels, such as "Substation" or "Golf Course."
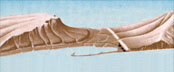
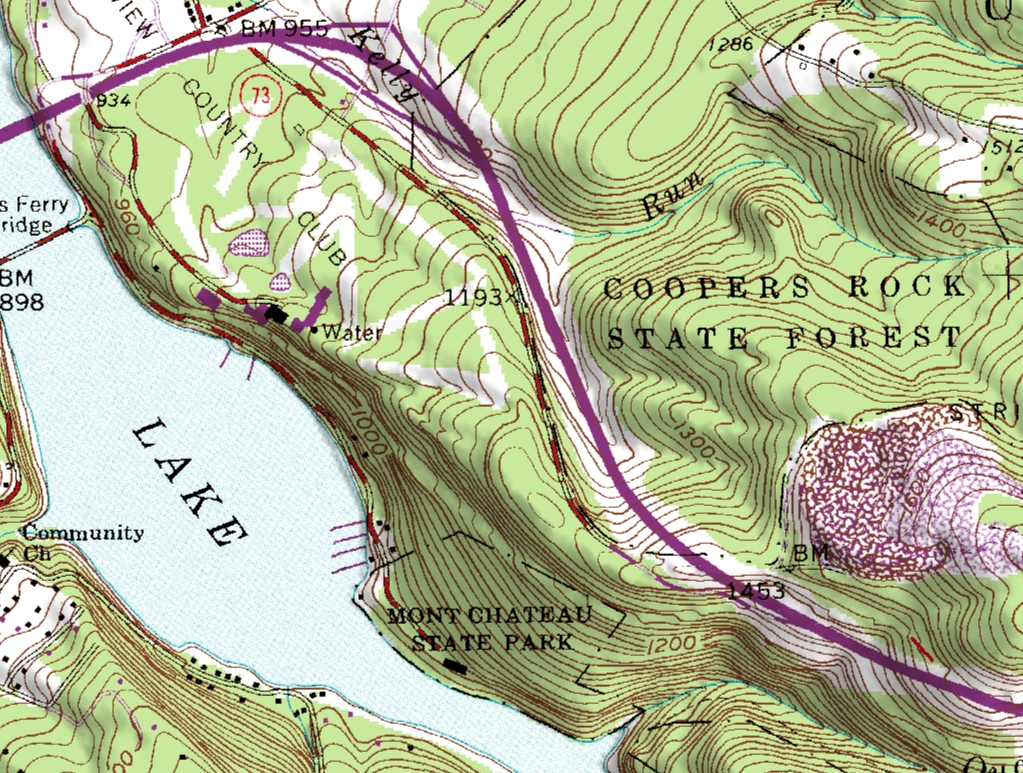
Ground Configuration shown by
contours |
Topographic contours are shown in brown by lines of different
widths. Each contour is a line of equal elevation; therefore, contours
never cross. They show the general shape of the terrain. To help the
user determine elevations, index contours (usually every fourth or
fifth contour) are wider. The narrower intermediate and supplementary
contours found between the index contours help to show more details of
the land surface shape. Contours that are very close together
represent steep slopes. Widely spaced contours, or an absence of
contours, means that the ground slope is relatively level. The
elevation difference between adjacent contour lines, called the
contour interval, is selected to best show the general shape of the
terrain. A map of a relatively flat area may have a contour interval
of 10 feet or less. Maps in mountainous areas may have contour
intervals of 100 feet or more. Elevation values are shown at frequent
intervals on the index contour lines to facilitate their
identification, as well as to enable the user to interpolate the
values of adjacent contours.
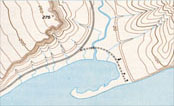
Bathymetric contours are generally offshore since they show the
shape and slope of the ocean bottom. They are shown in blue or black.
Bathymetric contours are shown in meters at intervals appropriate to
map scale and coastal profile, and should not be confused with depth
curves.
Depth curves are shown along coastlines and on inland bodies of
water where the data are available from hydrographic charts or other
reliable sources. Depth figures, shown in blue along the curves, are
in feet on older USGS maps and in meters on newer maps. Soundings,
individual depth values, may also be shown.
|