|
Topographic Maps - USGS Maps
USGS Maps Topographic & Others
Discover a small sample of the millions of maps
produced by the U.S. Geological Survey (USGS) in its mission to map
the Nation and survey its resources. This booklet gives a brief
overview of the types of maps sold and distributed by GeoMart. As an USGS Business Partner, GeoMart
provides a wide variety of maps, from topographic maps
showing the geographic relief and thematic maps displaying the geology
and water resources of the United States, to special studies of the
moon and planets.
[Topographic
Maps | Photoimage Maps |
Geologic Maps]
[Hydrologic
Maps | National Atlas Maps |
Order Information]
[7.5-minute
maps | 15-minute maps |
1:100,000-scale series |
[1:250,000-scale
series | State map series |
National park map series]
[Shaded-relief
maps | Topographic-bathymetric maps |
Antarctic maps]
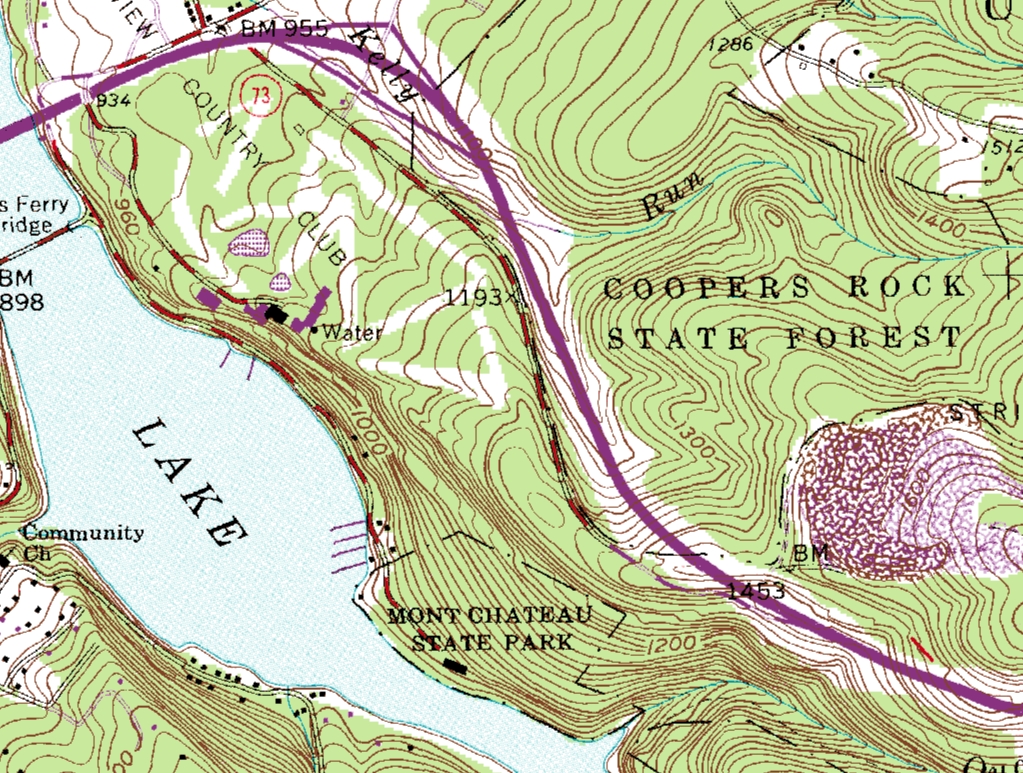
Most USGS topographic maps use brown contours to show the shape and
elevation of the terrain. Contour intervals vary, depending mainly on
the type of terrain and the scale of the map. (Scale is the
relationship between distance on the map and distance on the ground.)
The maps show and name prominent natural and cultural features.
Those at scales of 1:24,000 (1 inch = 2,000 feet) show an area in
detail. Such detail is useful for engineering, local area planning,
and recreational purposes.
Less detail is shown at scales of 1:50,000 (1 centimeter = 0.5
kilometer) to 1:100,000 (1 centimeter = 1 kilometer). They cover
larger areas and are used in land management and planning.
Maps at scales of 1:250,000 (1 inch = about 4 miles), 1:500,000 (1
inch = about 8 miles), and 1:1,000,000 (1 inch = about 16 miles) cover
very large areas on each sheet and are used in regional and statewide
planning.
Areas featured. Most USGS map series divide the United
States into quadrangles bounded by two lines of latitude and two lines
of longitude. For example, a 7.5-minute map shows an area that spans
7.5 minutes of latitude and 7.5 minutes of longitude, and it is
usually named after the most prominent feature in the quadrangle.
Others show a whole area--a county, State, national park, or place of
special interest.
| Top |
204K
 |
Part of the 7.5-minute series map "New Orleans West
Quadrangle, Louisiana," 1992, 1:24,000, Universal Transverse Mercator
projection, 22 x 27 inches.
The best known USGS maps are those of the 7.5-minute,
1:24,000-scale quadrangle series. A scale of 1:25,000 is used for maps
based on metric units (1 centimeter = 0.25 kilometer). The area
portrayed on each sheet ranges from 64 square miles at latitude 30
degrees north to 49 square miles at latitude 49 degrees north.
A scale of 1:24,000 allows considerable detail to be shown in the
quadrangle areas. It takes about 57,000 maps to cover the conterminous
48 States, Hawaii, and territories. All of these maps are now for sale
to the public. (For Alaska, 7.5-minute maps at 1:24,000 and 1:25,000
scale are available for areas around Anchorage, Fairbanks, and Prudhoe
Bay.)
The sheet size is about 22 x 27 inches north of latitude 31 degrees
and 23 x 27 inches south of that latitude.
For Puerto Rico, the scale of 1:20,000 (1 centimeter = 0.2
kilometer) was adopted in the 1950's because it was a metric scale and
the island had used metric measurements previously. The island was
originally mapped at 1:30,000 scale, but this was changed to 1:20,000
to provide greater detail. The sheet size is about 29 x 32 1/2 inches.
The U.S. Virgin Islands of St Croix, St. John, and St. Thomas have
been mapped at a scale of 1:24,000; central Pacific islands at scales
ranging from 1:10,000 to 1:50,000.
| Top |
81K

|
Part of the 15-minute map "Valdez (A-8), Alaska,"
quadrangle, 1960, reprinted 1986, 1:63,360, Universal Transverse
Mercator projection, 18 x 22 inches.
The standard map series covering Alaska is the 15-minute,
1:63,360-scale (1 inch = 1 mile) quadrangle series, usually having
dimensions of 15 minutes in latitude and from 20 to 36 minutes of
longitude. The area portrayed on each sheet ranges from 207 to 280
square miles, depending on the latitude.
The features shown on 15-minute maps are generally the same as
those shown on 7.5-minute maps, except that some may be generalized or
omitted because of the smaller scale and consequent space
restrictions. The sheet size is about 18 x 22 inches north of latitude
62 degrees and 17 x 27 inches south of that latitude.
About 97 percent of the 2,920 sheets covering Alaska at this scale
are completed; the remaining 3 percent to be done are in the Aleutian
Islands and the Bering Sea islands west of the mainland.
The 15-minute map series at a scale of 1:62,500 (1 inch =
approximately 1 mile) has been abandoned. The USGS 7.5-minute
topographic quadrangle map series is the official replacement for the
1:62,500-scales series.
| Top |
242K
 |
Part of "Hebgen Lake, Montana-Idaho-Wyoming,"
quadrangle, 1993, 1:100,000 Universal Transverse Mercator projection,
40 x 24 inches.
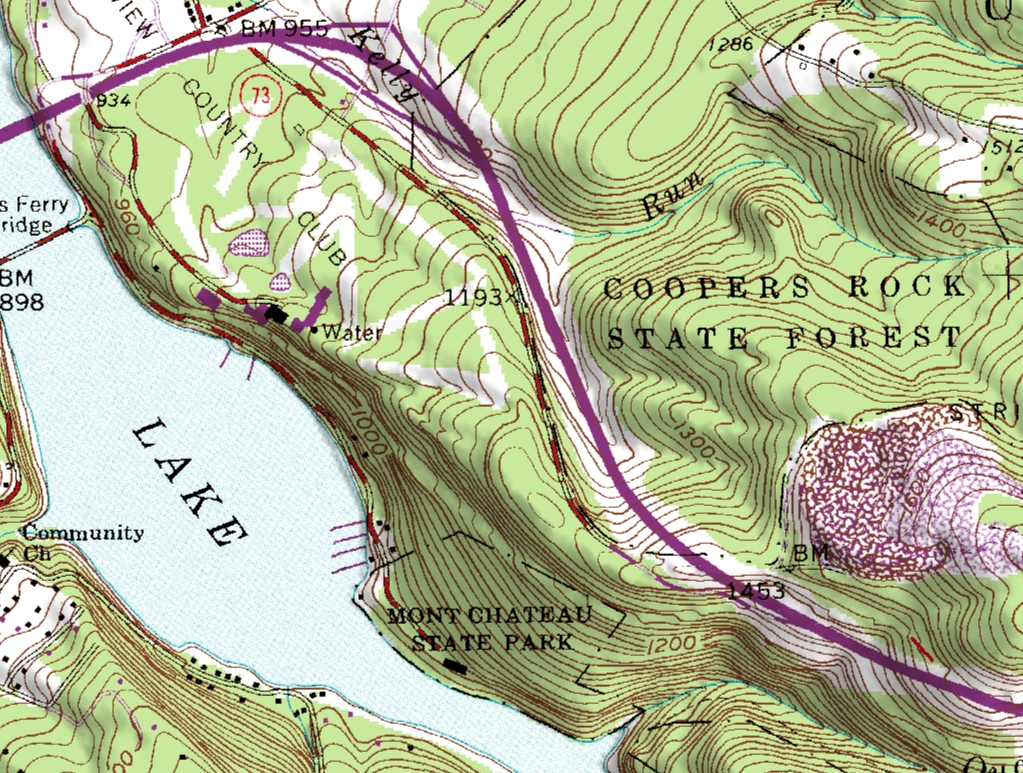
Virtually all of the conterminous United States and Hawaii are
covered by 30- x 60-minute quadrangle maps at a scale of 1:100,000.
Most of these maps are derived from 1:24,000-scale maps, but they show
distances and contour intervals in meters. Contours are at intervals
of 5, 10, 20, or 50 meters, depending on terrain relief. (Also see
County Maps.)
Some 1:100,000-scale quadrangle maps are published in planimetric
editions, without contours, Bureau of Land Management editions showing
Surface Management Status and Surface Minerals Management Status are
also available, primarily in the western States.
| Top |
96K
 |
Part of "Rolla, Missouri-Illinois," 1989,
1:250,000, Universal Transverse Mercator projection, 36 x 22 inches.
Maps in the 1:250,000-scale series are available for the entire
United States. They were originated by the U.S. Army Map Service
during the 1950's, but are now maintained by the USGS.
This series serves as base maps for aeronautical charts and
geologic maps, for geographic reference, and in planning regional land
use, transportation, and utility systems.
Conterminous United States. Quadrangles are 1 degree of
latitude by 2 degrees of longitude. Along the coasts dimensions are
modified to fit some maps. The series consists of 489 sheets. Ground
area shown varies with latitude, from 8,218 square miles at 30 degrees
north to 6,222 square miles at 49 degrees north. Sheet size is about
32 x 22 inches. About 8 percent of these sheets have been replaced by
folded metric maps, about 36 x 22 inches in size.
Hawaii. Quadrangles are 1 degree of latitude and from 1
degree 30 minutes to 1 degree 35 minutes of longitude. Ground area
mapped is from 6,645 to 6,990 square miles. Sheet size is about 29 x
22 inches.
Alaska reconnaissance series. This 153-sheet series covers
the mainland and adjacent islands. It is being superseded by the
Alaska 1:250,000-scale series. Quadrangles are 1 degree of latitude
and from 2 to 3 degrees of longitude. Ground area mapped is from 5,105
to 6,030 square miles for 1- x 2-degree quadrangles and from 4,580 to
7,310 square miles for 1- x 3-degree quadrangles. Sheet size is about
32 x 22 inches.
Alaska 1:250,000-scale series. Quadrangles, ground areas,
and sheet size match those in the reconnaissance series, but the
source data are more accurate. Hypsographic (terrain relief)
information is more generalized than on larger scale maps. Because the
contour interval is 50, 100, 200, or 500 feet, many small relief
features are not shown on this series.
| Top |
95K
 |
Part of "State of Virginia," base map, 1973,
1:500,000, Lambert conformal conic projection, 62 x 30 inches.
The State maps in this series are usually published in three
separate editions: (1) base map, (2) highway and contour map
(topographic edition), and (3) shaded-relief map. Most are at a scale
of 1:500,000, but a few have been released at 1:1,000,000 or other
scales.
The features shown are limited to areas within the State. No areas
of adjoining States are shown except shorelines in coastal States and
major streams and other water areas that form State boundaries.
Most maps in the series show one State per sheet, but some show
more than one State --New Hampshire and Vermont; Connecticut,
Massachusetts, and Rhode Island; Delaware and Maryland. (There is also
a separate sheet for Connecticut at 1:125,000 scale.)
Four States have more than one 1:500,000-scale sheet: California
(2), Michigan (2), Montana (2), and Texas (4).
Two maps of the State of Alaska show Alaska National Interest
Lands: shaded relief at 1:5,000,000 and planimetric at 1:2,500,000.
Alaska State maps are available at scales of 1:1,584,000, 1:2,500,000,
1:5,000,000, and 1:12,000,000. Alaska is the only State for which
there is no 1:500,000-scale map.
| Top |
206K
 |
Part of "Grand Canyon National Park and Vicinity,
Arizona," 1962, 1:100,000, polyconic projection, 60 x 38 inches.
Each of these topographic maps, some of them with shaded relief,
feature a national park, national monument, or other National Park
System unit. The maps are much like the standard quadrangle maps of
the same scale, but they highlight recreational features.
Scales range from 1:960 for the map of the Franklin D. Roosevelt
National Historic Site, New York, to 1:250,000 for the map of the
Denali National Park, Alaska. Sheet size ranges from about 21 x 17 to
61 x 46 inches.
| Top |
110K
 |
Part of "Grand Canyon National Park and Vicinity,
Arizona," shaded-relief edition of 1972, 1:62,500, polyconic
projection, 59 1/2 x 37 1/2 inches.
The USGS publishes shaded-relief editions of certain topographic
maps to accentuate physiographic features of special interest and for
some State, Antarctic, and national park maps. These maps use shaded
relief, as well as contour lines, to represent the shape of the
terrain.
The pictorial effect of such maps is emphasized by relief
shading--a halftone overprint that simulates the appearance of
sunlight and shadows on the terrain and creates the illusion of
three-dimensional topography.
| Top |
307K
 |
Part of the topographic-bathymetric map "Kedges
Straits, Maryland," quadrangle, 1972, bathymetry added 1987, by the
USGS and the National Ocean Survey, 1:24,000, Lambert conformal conic
projection, 22 x 28 inches.
These USGS maps show in one format and one edition the data for a
land-water area previously shown separately as a topographic map and a
bathymetric map.
On topographic-bathymetric maps, contour lines show elevations of
the land areas above sea level, and isobaths (bathymetric contours)
show the form of the land below the water surface.
Some bathymetric maps show magnetic and gravity data in addition to
water depths.
Because coastal zones include both land and water, maps of such
areas include both topographic and bathymetric data. In order to
produce these coastal maps, the National Ocean Service provided
bathymetric data to be added to USGS topographic maps. The combined
map serves the needs of oceanographers, marine geologists, land use
planners, physical scientists, conservationists, and others having an
interest in management of the coastal zone, the wetlands, and the
offshore environment. Topographic-bathymetric maps at a scale of
1:24,000 are popular with people who enjoy fishing.
Topographic-bathymetric maps are also available at 1:100,000 and
1:250,000 scale.
| Top |
146K
|
Part of "Bear Peninsula, Antarctica," 1978, by USGS
in cooperation with the National Science Foundation, 1:250,000, polar
stereographic projection, 29 x 26 inches.
1:50,000. Topographic maps at this scale with 50-meter
contour intervals are available in the Ross Island-Taylor Glacier
area. This series presently totals 13 sheets, with shaded relief added
to the most recent maps.
1:250,000. A topographic shaded-relief reconnaissance and a
geologic reconnaissance series at this scale have contour intervals of
200 meters and also show bathymetric information for coastal areas.
The topographic series is the primary map source for the planning,
logistic support, and multidisciplinary investigations of the U.S.
Antarctic Research Program. There are 21 satellite image maps at this
scale available in the Ross Island-Dry Valley and the Siple Coast
areas.
1:500,000. Two series of maps--topographic shaded relief and
sketch--are published at this scale. The topographic maps, which show
coastal areas of Wilkes Land and Enderby Land, were made for the
International Geophysical Years (1955-58). There are also two
satellite image maps at 1:500,000 scale.
1:1,000,000. A limited number of topographic maps and
satellite image maps have been published at this scale. Topographic
maps have contours at 100, 300, or 500 meters.
1:2,188,800. A reconnaissance sketch and topographic map of
the Ross Ice Shelf at this scale was made in support of the Ross Ice
Shelf Geophysical and Glaciological Program.
1:5,000,000. Image map of the Antarctic continent using
advanced very high resolution radiometer (AVHRR) data from the
National Oceanic and Atmospheric Administration satellites.
Special photomosaics are available of McMurdo Station (1:25,000),
Hut Point Peninsula (1:13,500), and Amundsen-Scott South Pole Station
(1:1,250).
| Top |
Photoimage Maps
[Orthophotomaps |
Orthophotoquads |
Border maps |
Satellite image maps]
Orthophotomaps
67K
 |
Part of "Callao Quadrangle, Utah," 1972, 1:24,000,
7.5-minute orthophotomap, Lambert conformal conic projection, 22 x 27
inches.
Orthophotomaps are multicolored, distortion-free, photographic
image maps. They are produced in standard 7.5-minute quadrangle format
from aerial photographs, and they show a limited number of the names,
symbols, and patterns found on 7.5-minute topographic quadrangle maps.
Most of these maps are at a scale of 1:24,000, but some are at
1:25,000.
They show subtle topographic detail in areas of very low relief,
such as marshlands and coastal zones. For that reason, they are
published as the topographic quadrangle maps for some coastal areas.
Some orthophotomaps of high relief areas also have been published.
Coverage is mainly along the Gulf and Atlantic coasts (Texas to
Maryland), the Mexican border, and in some areas of Alaska, Minnesota,
New Mexico, Nevada, and Utah.
They show State, county, and local boundaries; names of cities and
towns; roads and highways with symbols and color; railroads; names of
selected rivers, streams, and lakes; and topographic contours.
| Top |
Orthophotoquads
130K
 |
Part of "Lewes, Delaware," quadrangle, 1980,
1:25,000, orthophotoquad, Universal Transverse Mercator projection, 22
x 27 inches.
Orthophotoquads are black-and-white, distortion free, photographic
image maps that are produced in standard 7.5-minute quadrangle format
from aerial photographs, but have no contours and only minimal
cartographic treatment. They include only a few names and symbols.
Orthophotoquads are available for selected areas along the east
coast of the United States and supplement standard 7.5-minute
topographic maps in these areas.
| Top |
Border maps
 Part of "Las Conchas, Texas-Chihuahua," 1983, produced
by the USGS in cooperation with the Department of the Treasury, U.S.
Customs Service, 1:25,000, Universal Transverse Mercator projection,
28 x 22 inches.
Part of "Las Conchas, Texas-Chihuahua," 1983, produced
by the USGS in cooperation with the Department of the Treasury, U.S.
Customs Service, 1:25,000, Universal Transverse Mercator projection,
28 x 22 inches.
U.S.-Mexico. 203 natural color photoimage maps at a scale of
1:25,000 have been printed, bracketing the U.S.-Mexico border and
covering the entire international boundary from the Pacific Ocean to
the Gulf of Mexico.
 Part of "Rouses Point Port of Entry, Vermont-New
York-Quebec," 1977, produced by the USGS in cooperation with the
Department of the Treasury, U.S. Customs Service, 1:25,000, Universal
Transverse Mercator projection, 19 1/2 x 22 1/2 inches.
Part of "Rouses Point Port of Entry, Vermont-New
York-Quebec," 1977, produced by the USGS in cooperation with the
Department of the Treasury, U.S. Customs Service, 1:25,000, Universal
Transverse Mercator projection, 19 1/2 x 22 1/2 inches.
U.S.-Canada. A series of maps is available that provides
natural color photoimage coverage for a 180-kilometer (about a
110-mile) strip along the U.S.-Canada border from Massena, New York,
to East Richford, Vermont. These maps are formatted as 7.5-minute,
1:25,000-scale quadrangles that are centered approximately on the
border and cover areas of 10 kilometers (about 6.2 miles) east-west
and 11 kilometers (about 6.8 miles) north-south.
| Top |
Satellite image maps
 Part of "Benton Range, California-Nevada, Landsat 5,"
1987, 1:100,000, Universal Transverse Mercator projection, 42 x 24
inches.
Part of "Benton Range, California-Nevada, Landsat 5,"
1987, 1:100,000, Universal Transverse Mercator projection, 42 x 24
inches.
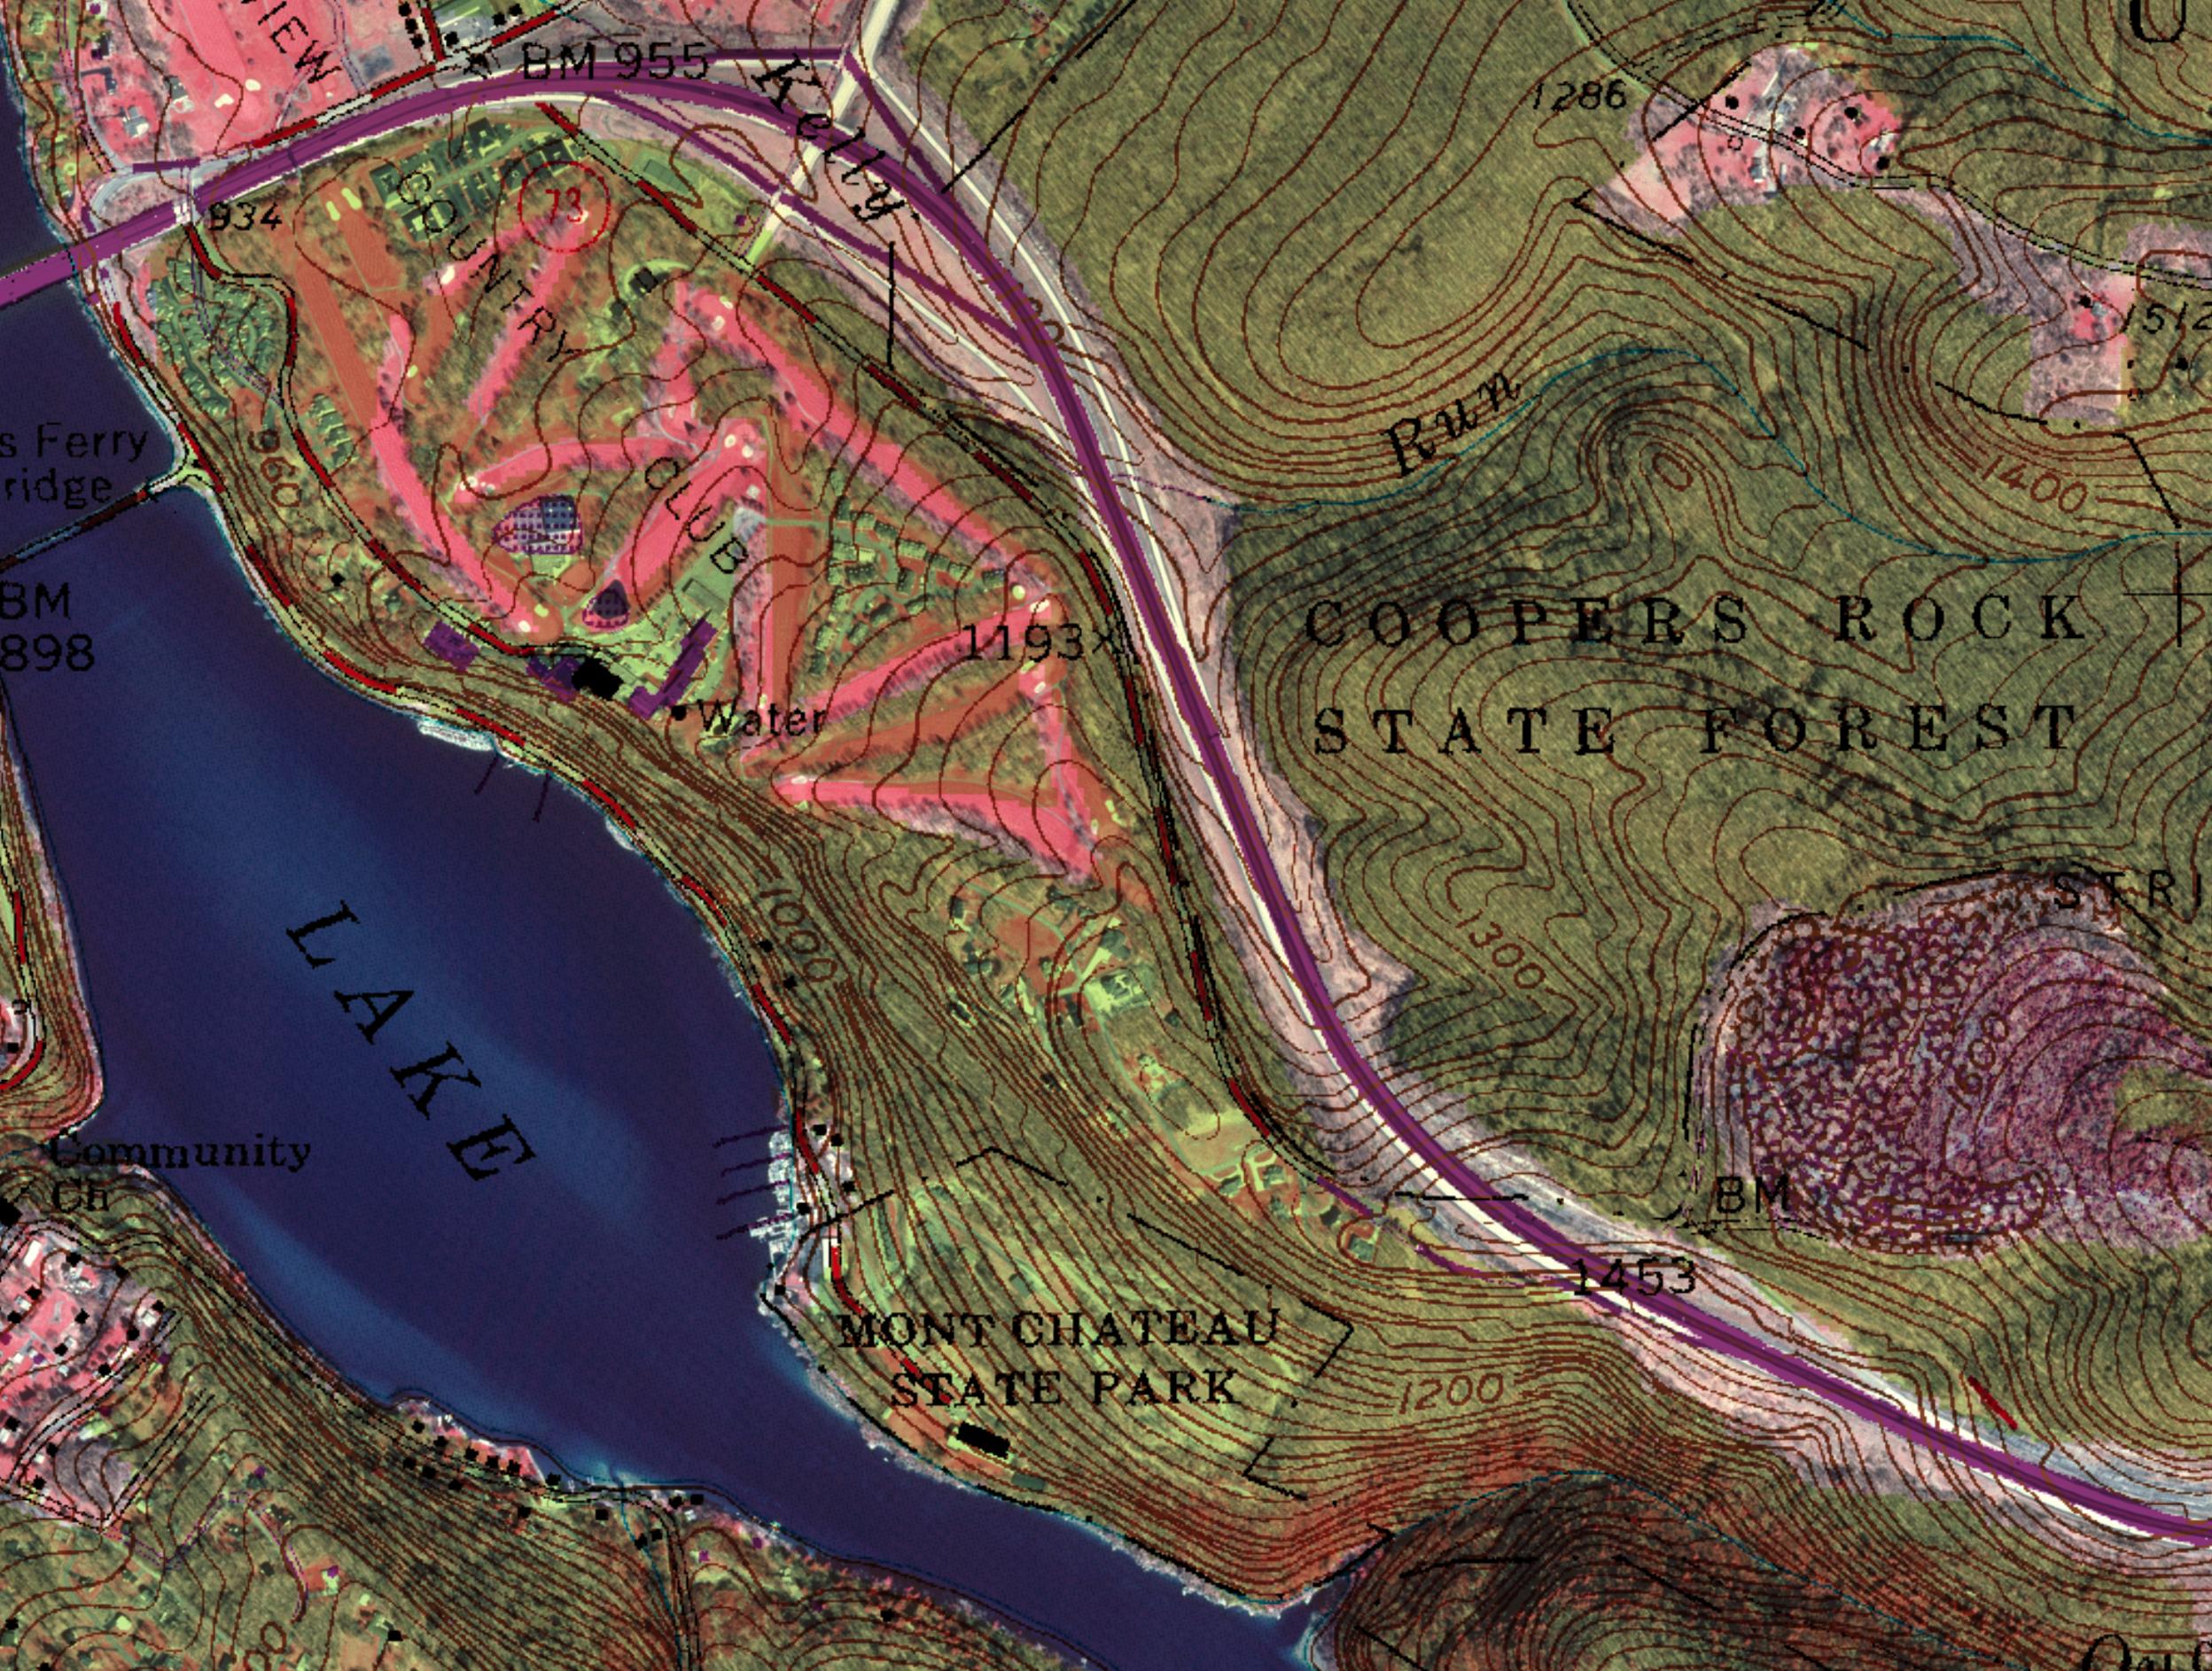
Satellite image maps are multicolor or black-and-white
photograph-like maps made from data collected by Earth resources
satellites. They are a diverse group of experimental maps printed in a
variety of scales and sizes, ranging from 1:24,000 for Point Loma,
California, to 1:7,500,000 for the conterminous 48 States.
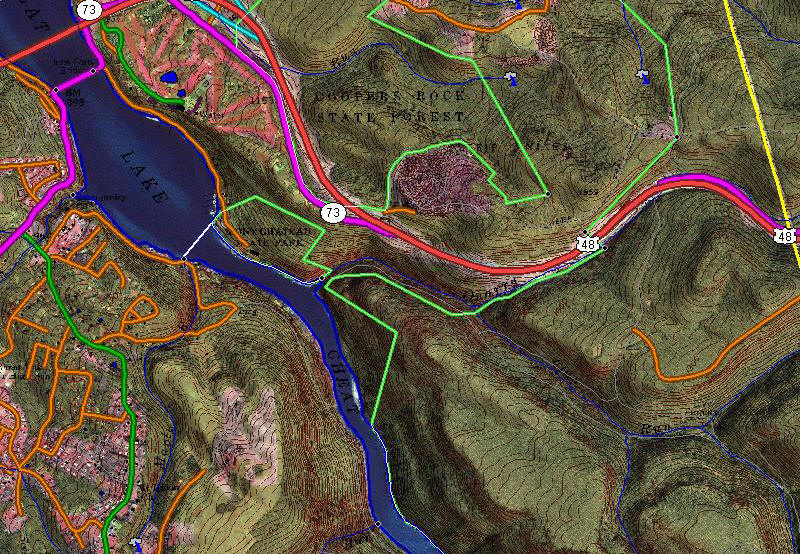
Most satellite image maps are printed to simulate color-infrared
photography by combining imagery that was scanned in red, green, and
infrared wave lengths of light.
On color-infrared imagery, growing crops, grasses, and woodlands
usually appear in shades of red; conifer forests in shades of reddish
brown; clear water as dark blue or black; turbid water as light blue
or gray; and cultural features such as cities and highways as steely
blue-gray.
Satellite image maps are available for selected areas in about half
of the States and the District of Columbia and such areas as
Antarctica, the Bahamas, and Iceland. They are also available for the
conterminous United States as a National Atlas sheet and for the
entire States of New Jersey, Georgia, Arizona, Florida, and Utah.
Many image maps at 1:250,000 scale have topographic maps printed on
the reverse sides. Each map is identified by its latitude and
longitude and is given a distinctive name, for example, "Upper
Chesapeake Bay." Major water bodies are used for map names when
appropriate because they show the greatest contrast and are easily
recognized. Image maps covering standard 1:250,000-scale quadrangle
areas carry the same name as the topographic map.
| Top |
[Oil and gas investigations |
Geologic quadrangle maps |
Miscellaneous investigations]
[Miscellaneous field studies |
Coal investigations | State geologic maps |
Planet and moons]
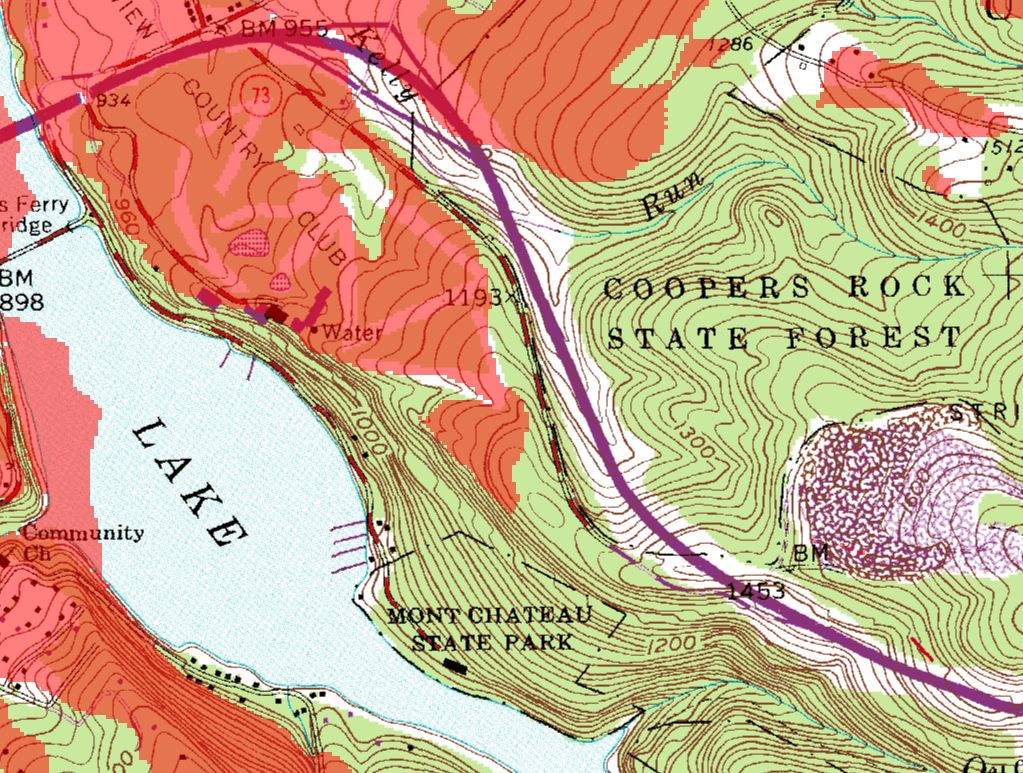
Geologic maps use a combination of lines, symbols, and colors to
show the composition and structure of earth materials and their
distribution across and beneath the Earth's surface. They generally
show bedrock formations like granite or limestone, surficial units
such as sediment deposited by glaciers or rivers, and structures like
folds and faults. Geologic maps can be used to identify geologic
hazards, locate natural resources, and facilitate land-use planning.
The USGS makes many kinds of geologic maps. These maps are
available as single or multiple sheets, many of which are folded and
placed in a paper jacket. Other geologic maps are enclosed in
envelopes bound with USGS reports such as professional papers,
bulletins, and water-supply papers. The texts of these reports contain
descriptive and interpretive matter that supplements the information
on the geologic maps.
USGS geologic maps are typically plotted on topographic or
planimetric bases. They range in scale from 1:20,000 to 1:2,500,000
depending on the type of information to be shown and the purpose of
the map.
USGS Geologic Map Indexes are a State-by-State summary of published
geologic mapping by Federal, State, academic, professional, and other
organizations.
| Top |
 Part of "Structure Contours Map on Top of the Middle
Member of the Piper Formation of Middle Jurassic Age in the Williston
Basin and Adjacent Areas in Montana, North Dakota, and South Dakota,"
1959, 53 1/2 x 39 inches.
Part of "Structure Contours Map on Top of the Middle
Member of the Piper Formation of Middle Jurassic Age in the Williston
Basin and Adjacent Areas in Montana, North Dakota, and South Dakota,"
1959, 53 1/2 x 39 inches.
The Oil and Gas Investigations Maps (OM) Series and Charts (OC)
Series show the subsurface structure and stratigraphy and surface
geology of selected oil and gas fields and of other areas having
hydrocarbon potential. They may be black and white or multicolor.
Most maps and charts have an explanatory text printed on the margin
or in a separate pamphlet. Some are on multiple sheets. Sheet sizes
and projections vary. Each map or chart is folded and placed in a
paper jacket.
Maps. Each map is plotted on a topographic or planimetric
base. Typically included are cross sections, columnar sections,
correlation diagrams, and well logs. Maps numbered 1 to 109 in the
series are designated preliminary; those from number 110 onward carry
the prefix OM. Most maps in this series were published before 1965.
Charts. Charts generally consist of well logs, correlation
diagrams, graphs, and tables. Some charts include seismic data or
maps. Charts numbered 1 to 39 in the series are considered
preliminary; those from number 40 onward carry the prefix OC.
| Top |
 Part of "Geologic Map of the Casamero Lake Quadrangle,
McKinley County, New Mexico," 1993, 1:24,000, Universal Transverse
Mercator projection, 44 x 34 inches.
Part of "Geologic Map of the Casamero Lake Quadrangle,
McKinley County, New Mexico," 1993, 1:24,000, Universal Transverse
Mercator projection, 44 x 34 inches.
The Geologic Quadrangle (GQ) Series has more than 1,700 multicolor
maps that show the bedrock, surficial, or engineering geology of
selected 7.5- or 15-minute quadrangles in the United States. The
series, begun in 1949, is a continuation of the earlier Folios of the
Geologic Atlas of the United States (1894 to 1945).
Each map is accompanied by an explanatory text printed on the map
margin or occasionally as a separate pamphlet. Some maps include cross
sections for clarity and to show relations at depth; some contain
columnar sections describing stratigraphy; some maps show structure
contours.
Sheet size and projection depend on the base map on which the
geology is plotted. The most common scale is 1:24,000; some are at
1:31,680, 1:62,500, or 1:63,360 (Alaska). Each map is folded and
placed in a paper jacket.
| Top |
 Part of "Bedrock and Engineering Geologic Maps of New
York County and Parts of Kings and Queens Counties, New York, and
Parts of Bergen and Hudson Counties, New Jersey," sheet 2, 1994,
1:24,000, polyconic projection, 41 x 46 inches.
Part of "Bedrock and Engineering Geologic Maps of New
York County and Parts of Kings and Queens Counties, New York, and
Parts of Bergen and Hudson Counties, New Jersey," sheet 2, 1994,
1:24,000, polyconic projection, 41 x 46 inches.
The Miscellaneous Investigations (I) Series contains mostly
multicolor maps covering diverse topical material such as bedrock and
surficial geology, marine geology, mineral and energy resources, and
geophysics and geochemistry. The series also includes maps of the
Earth's Moon and other planetary bodies, hydrogeology, landforms,
earthquake epicenters, map projections, and oblique-view maps.
Maps cover both quadrangles and irregularly shaped areas and are
usually shown on a topographic or planimetric base at a variety of
scales and in a variety of formats. Many pre-1961 I Series maps are
photogeologic maps that were compiled from aerial photographs with
little or no field checking.
Most maps have explanatory text printed on the map margin or in a
separate pamphlet. A few are on multiple sheets.
Sheet sizes and projections vary. Each map is folded and placed in
a paper jacket.
| Top |
 Part of "Geologic Map of the Cholame Quadrangle, San
Luis Obispo County, California," 1991, 1:24,000, polyconic projection,
35 x 46 inches.
Part of "Geologic Map of the Cholame Quadrangle, San
Luis Obispo County, California," 1991, 1:24,000, polyconic projection,
35 x 46 inches.
The Miscellaneous Field Studies (MF) Series contains more than
2,200 mostly black-and-white maps that cover nearly all aspects of
USGS investigations and research. The series, begun in 1950, had been
known earlier as the Mineral Investigations Field Studies Series.
Pre-1971 maps show geology in relation to specific mining or
mineral-deposit studies; later maps are on various subjects such as
bedrock and surficial geology, offshore geology, mineral resource
assessments, geophysical and geochemical surveys, and environmental
studies.
The maps are either the preliminary results of ongoing studies or
the final results of studies that lack the scope necessary for the I
and GQ Series. They are intended for rapid publication and are mostly
author prepared.
MF maps cover both quadrangles or irregularly shaped areas and are
usually plotted on topographic or planimetric bases. Most maps are
accompanied by a text on the map margin or in a separate pamphlet.
Some are on multiple sheets.
Scale, sheet sizes, and projections vary. Each map is folded and
placed in a paper jacket.
| Top |
 Part of "Geologic Map and Lignite Deposits of the New
Salem Quadrangle, Morton County, North Dakota," 1992, C-62, 1:24,000,
Universal Transverse Mercator projection, 34 x 28 inches.
Part of "Geologic Map and Lignite Deposits of the New
Salem Quadrangle, Morton County, North Dakota," 1992, C-62, 1:24,000,
Universal Transverse Mercator projection, 34 x 28 inches.
The Coal Investigations (C) Series contains multicolor or
black-and-white geologic maps that show bedrock geology, stratigraphy,
and structural relations of selected coal resource areas of the
Nation. The numbering of these maps began in 1950; a few unnumbered
maps were produced as early as 1935.
Each map has an explanatory text printed on the map margin or in a
separate pamphlet. Maps also typically show cross sections, columnar
sections, structure contours, and measured sections of coal zones.
C Series maps cover quadrangles or irregularly shaped areas. The
maps are plotted on topographic or planimetric bases at a variety of
scales. The most common formats are individual 7.5-minute or 30- by
60-minute quadrangles.
Sheet size and projection vary. Each map is folded and placed in a
paper jacket.
| Top |
 Part of "Geologic Map of Oregon," 1991, sheet 1 of 2,
1:500,000, Lambert conformal conic projection, 54 x 42 inches.
Part of "Geologic Map of Oregon," 1991, sheet 1 of 2,
1:500,000, Lambert conformal conic projection, 54 x 42 inches.
USGS State geologic maps are plotted on USGS standard topographic
bases. Scales vary from 1:125,000 to 1:2,500,000, although 1:250,000
and 1:500,000 are the most common. Sheet sizes vary widely; some maps
are on multiple sheets. Projections also vary.
| Top |
221K
 |
Part of "Geologic Map of the South Side of the
Moon," 1979, 1:5,000,000, Polar stereographic projection, 41 x 33
inches.
In 1960, the USGS established an astrogeology program on behalf of
NASA to support lunar and planetary exploration. A prime activity of
the program is the systematic mapping of the stratigraphy and
structure of the Moon, Mars, Venus, Mercury, and the moons of the
outer planets.
Many USGS maps of the Moon, Mars, Mercury, Venus, and the moons of
Jupiter and Saturn are now available for purchase by the public. These
maps are in the Miscellaneous Investigations (I) Series.
The maps include geologic, topographic, photomosaic, and
shaded-relief maps.
The scales, projections, and sheet sizes of these maps vary widely.
| Top |
182K
 |
Part of "Hydrologic Unit Map-1981, State of
Nevada," 1:500,000, Lambert conformal conic projection, 45 x 65 1/2
inches.
The Hydrologic Investigations Atlases (HA) Series contains either
black-and-white or multicolor maps showing a wide range of
water-resources information, such as depth to ground water, floods,
irrigated acreage, producing aquifers, water availability,
surface-water discharge, chemical or mineral content of water, surface
impoundments, and water temperature.
More than 700 hydrologic atlases have been published; most HA maps
were prepared in cooperation with State, county, and municipal
agencies. Maps vary in sheet size, number of sheets, and scale.
Principal maps are most frequently presented at a scale of 1:24,000;
however, much smaller scales are used for larger areas of study.
169K
 |
Part of "Ground Water Atlas of the United States,
Segment 6, Alabama, Florida, Georgia, South Carolina," James A.
Miller, 1990, 1:2,500,000, 18 x 23 inches. This illustration shows the
extent of major aquifers beyond Segment 6.
A special multisheet hydrologic atlas series, "Ground Water Atlas
of the United States," is being published. This series includes maps
and descriptions of the principal aquifers of the Nation. Multicolor
maps at scales ranging from 1:2,500,000 to 1:100,000 show the
location, extent, thickness, potentiometric surface, and variations in
water quality for the aquifers. Nationwide summary maps are at a scale
of 1:7,500,000. Supplementary illustrations and simplified text
describe the most important aspects of the geology and hydrology of
each aquifer.
| Top |
National Atlas Maps
[Reference maps |
Thematic maps]
The National Atlas of the United States of America (1970) contains
819 maps and charts on 416 pages. It is out of print but can be found
in many libraries.
Separate sheets of selected reference maps and thematic maps from
the Atlas are available from the USGS. Some of the sheets have been
updated and new maps are being published in updated formats.
| Top |
One set of multicolor planimetric (no contours) maps shows the
United States in 21 sections at 1:2,000,000 scale. Another available
map shows the United States at 1:7,500,000 scale, with insets for
Alaska and Hawaii. The Alaska inset is shown at 1:17,000,000 scale.
Each map is printed on one side of a 28- x 19-inch sheet.
| Top |
 Part of the thematic map "Early Indian Tribes, Culture
Areas, and Linguistic Stocks," William C. Sturtevant, Smithsonian
Institution, 1967, National Atlas 1:7,500,000, Albers equal area
projection, 28 x 19 inches.
Part of the thematic map "Early Indian Tribes, Culture
Areas, and Linguistic Stocks," William C. Sturtevant, Smithsonian
Institution, 1967, National Atlas 1:7,500,000, Albers equal area
projection, 28 x 19 inches.
 Part of the thematic map "Potential Natural
Vegetation," 1966, revised 1985, National Atlas, 1:7,500,000, Albers
equal area projection, 28 x 19 inches.
Part of the thematic map "Potential Natural
Vegetation," 1966, revised 1985, National Atlas, 1:7,500,000, Albers
equal area projection, 28 x 19 inches.
Special-subject maps at scales of 1:7,500,000, 1:17,000,000 and
1:34,000,000 occupy 281 pages of the 1970 Atlas. Some special-subject
maps recently added to this series were not in the 1970 Atlas and may
be at different scales. Among the atlas series maps now available as
separates are:
United States Shaded Relief (1969)
Alaska Shaded Relief (1969)
Physiography and Physiographic Divisions (four maps, 1968)
Land-Surface Form (1968)
Classes of Land-Surface Form (1964)
Tectonic Features, Alaska (1968)
Tectonic Features, U.S. (1967)
Geology (1966)
Surficial Geology (1979)
Potential Natural Vegetation (1985)
Monthly Sunshine (1965)
Annual Sunshine, Evaporation, and Solar Radiation (1969)
Monthly Average Temperature (1965)
Monthly Minimum Temperature (1965)
Monthly Maximum Temperature (1965)
Major Forest Types (1967, 1987 revisions to Alaska)
Federal Lands (1968)
Networks of Ecological Research Areas (1983)
Principal Lands Where Exploration and Development of Mineral Resources
are Restricted (1981)
Population Distribution, Urban and Rural: 1960
Population Distribution, Urban and Rural: 1970
Early Indian Tribes, Culture Areas, and Linquistic Stocks (1967)
Congressional Districts for the 100th Congress (1987)
Territorial Growth (1986)
Engineering Aspects of Karst (1984)
Population (1970)
Surface Water (1965)
Surface Water (1988)
Soils (1985)
National Wilderness Preservation System (1987)
Counties (1987)
Presidential Elections 1789-1968 and 1972-1984
Highways (1987)
Coastal Erosion and Accretion (1985)
Coastal Hazards (1985)
Electing the President 1789-1988
Presidential Election of 1988 (1989)
U.S. Satellite View (1990)
National Wild and Scenic Rivers System (1992)
| Top |
To obtain free map indexes and to order topographic maps of any of
the wide variety of maps seen above contact:
GeoMart
516 Villanova Court
Ft Collins, CO 80525
800-248-6277
970-416-8340
800-321-6277
970-416-8345
Fax
Customer@GeoMart.com
|