|
Topographic Maps - USGS Maps - General
Information
Topographic Mapping
[ The Changing Landscape of
Topographic Mapping | What is a Topographic Map?
]
[ Topographic mapping and the USGS |
Common Mapping Scales ]
[ The USGS and the Mapping of America |
What's in a Name? ]
[ Map Separates | The
Digital Mapping Revolution ]
The Changing Landscape of Topographic Mapping
The U.S. Geological Survey (USGS) produced its first topographic
map in 1879, the same year it was established. Today, more than 100
years and millions of map copies later, topographic mapping is still
a central activity for the USGS. The topographic map remains an
indispensable tool for government, science, industry, and leisure.
Much has changed since early topographers traveled the unsettled
West and carefully plotted the first USGS maps by hand. Advances in
survey techniques, instrumentation, and design and printing
technologies, as well as the use of aerial photography and satellite
data, have dramatically improved mapping coverage, accuracy, and
efficiency. Yet cartography, the art and science of mapping, may
never before have undergone change more profound than today.
A mapping revolution is underway. New technologies are altering
the production and use of traditional maps. Even more significantly,
the information age has introduced a new cartographic product that
is changing the face of mapping: digital data for computerized
mapping and analysis.
The computer is extending mapping beyond its traditional
boundaries. New applications emerge with each technological advance.
At their most basic, digital data applications make it possible to
display maps on a computer, even a home personal computer. At their
most advanced, digital data applications stretch the definition of
cartography.
This booklet examines topographic mapping and the USGS in this
changing cartographic world. It describes the topographic map, its
use, its history, its production, and--in light of new technology
and the digital mapping revolution--its potential.
| Top |
What is a Topographic Map?
Whether on paper or on a computer screen, a map is the best tool
available to catalog and view the arrangement of things on the
Earth's surface. Maps of various kinds--road maps, political maps,
land use maps, maps of the world--serve many different purposes.
One of the most widely used of all maps is the topographic map.
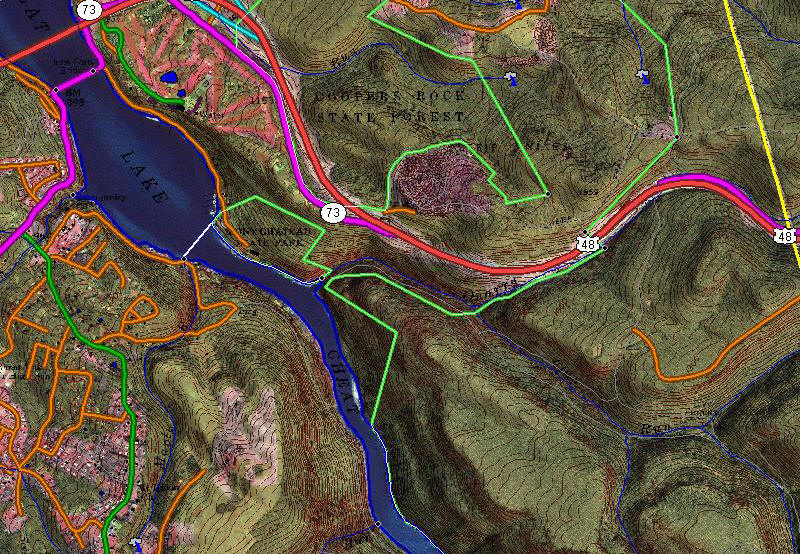
The feature that most distinguishes topographic maps from maps of
other types is the use of contour lines to portray the shape and
elevation of the land. Topographic maps render the three-dimensional
ups and downs of the terrain on a two-dimensional surface.
Topographic maps usually portray both natural and manmade
features. They show and name works of nature including mountains,
valleys, plains, lakes, rivers, and vegetation. They also identify
the principal works of man, such as roads, boundaries, transmission
lines, and major buildings.
The wide range of information provided by topographic maps make
them extremely useful to professional and recreational map users
alike. Topographic maps are used for engineering, energy
exploration, natural resource conservation, environmental
management, public works design, commercial and residential
planning, and outdoor activities like hiking, camping, and fishing.
| Top |
Topographic Mapping and the USGS
A longstanding goal of the USGS has been to provide complete,
large-scale topographic map coverage of the United States. The
result is a series of more than 54,000 maps that cover in detail the
entire area of the 48 contiguous States and Hawaii.
Produced at a scale of 1:24,000 (some metric maps are produced at
a scale of 1:25,000), these maps are commonly known as 7.5-minute
quadrangle maps because each map covers a four-sided area of 7.5
minutes of latitude and 7.5 minutes of longitude. The United States
has been systematically divided into precisely measured quadrangles,
and adjacent maps can be combined to form a single large map. The
7.5-minute quadrangle map series is popular as a base for maps of
many different types and scales.
Because of its large land mass and sparse population, the primary
scale for mapping Alaska is 1:63,360 (1 inch represents 1 mile).
Each Alaska map quadrangle covers 15 minutes of latitude. The areas
covered by these maps vary from 20 to 36 minutes of longitude,
depending on location. There are 2,700 maps in the Alaska 15-minute
quadrangle series.
In addition to the 1:24,000-scale maps, complete topographic
coverage of the United States is available at scales of 1:100,000
and 1:250,000. Maps are also available at various other scales.
The amount of detail shown on a map is proportionate to the scale
of the map: the larger the map scale, the more detail shown. Since 1
inch on the map represents 2,000 feet on the Earth, 1:24,000-scale
maps depict considerable detail. Such large-scale maps of developed
areas show features like schools, churches, cemeteries, campgrounds,
ski lifts, and even fence lines. Many of these features are
generalized or omitted in smaller scale topographic maps.
| Top |
Other USGS map products
Topographic maps are not the only cartographic products available
from the USGS. The USGS publishes and distributes a variety of
special-purpose maps. Some of these are topographic-bathymetric
maps, photo image maps, satellite image maps, geologic maps, land
use and land cover maps, and hydrologic maps. Each type of map has a
distinct purpose and appearance and, like topographic maps, all are
available to the public for the cost of reproduction and
distribution. USGS maps are not copyrighted.
| Top |
Common Mapping Scales
7.5 minute 1:24,000 scale, 1 inch represents
2,000 feet |
1:100,000 scale, 1 inch represents about 1.6
miles |
1:250,000 scale, 1 inch represents about 4 miles
|
| Top |
The USGS and the Mapping of America
Planetable surveying by turn-of-the-
century USGS topographers |
Initially charged by Congress with the "classification of the
public lands," the USGS began topographic and geologic mapping in
1879. Most of the early USGS mapping activities took place in the
vast, largely uninhabited Western United States.
Extreme challenges awaited these mapping pioneers. Travel was
arduous and costly. Many locations could be reached only by mule
pack train. Furthermore, surveying and mapping instruments were
crude by today's standards. Most maps were made using a classic
mapping technique called planetable surveying.
Planetable surveying took great skill and, depending on the
mapping site, equal daring. Carrying a planetable--essentially a
portable drawing board on a tripod with a sighting device--the
topographer would climb to the area's best vantage point and
carefully plot on the map those features that could be seen and
measured in the field. Planetable surveying remained the dominant
USGS mapping technique until the 1940's, when it gave way to the
airplane and the age of photogrammetry.
| Top |
Mapping in the age of flight
Mapmaking entered a new era with the use of aerial photographs
and the development of photogrammetry. Photogrammetry is the science
of obtaining reliable information by measuring and interpreting
photographs.
The use of aerial photographs for mapping was pioneered in the
1930's, when the USGS assisted the Tennessee Valley Authority in
mapping its area of responsibility. This project was the first
full-scale test of the use of aerial photographs in creating maps.
Aerial photographs increased dramatically during World War II when
its use proved crucial for gathering military intelligence. Aerial
photographs and photogrammetry led to a revolution in mapmaking.
This change has significantly increased map coverage and enhanced
map standardization.
| Top |
Making a topographic map
Overlapping aerial
photographs provide
stereoscopic coverage
of areas to be mapped.
|
Producing an accurate topographic map is a
long and complex process. It can take 5 years from the
identification of a mapping requirement to the printing of a
large-scale map like one of the USGS 7.5-minute, 1:24,000-scale
quadrangle maps. This process requires a team of professionals and a
series of closely coordinated steps.
A closer look at the procedures traditionally
involved in topographic mapmaking demonstrates the combination of
science, technology, and artistry required to produce a USGS map.
| Top |
Aerial Photography
The first step in producing a topographic map
is acquiring aerial photographs of the area being mapped. A pair of
aerial photographs--each showing the same ground area taken from a
different position along the flight line--are viewed through an
instrument called a stereoscope, producing a three-dimensional view
of the terrain from which a cartographer can draw a topographic map.
Most photographs used for the USGS's
topographic mapping program are now obtained through the
National Aerial Photography Program (NAPP). NAPP flights are
flown in a north-south direction along carefully determined flight
lines. It takes 10 precisely positioned NAPP aerial photographs to
provide the stereoscopic coverage needed for each 7.5-minute
quadrangle map.
Every aspect of the aerial photography process
requires precision and meticulous planning.
- Specialized cameras are used to meet the
exacting geometry needed to faithfully reproduce the stereoscopic
model. Such a camera can cost more than $250,000.
- To ensure that all NAPP photographs are at
a scale of 1:40,000, NAPP flights are flown at a consistent
altitude above the terrain.
- Photographs must be taken when the sky is
clear and with the Sun at the proper angle for the type of ground
being photographed.
- Even seasonal factors must be considered.
In an area of hardwood forest, for example, it is usually best to
take the photographs when leaves are off the trees so that terrain
features are more clearly visible.
A pair of stereoscopic aerial
photographs taken over Villanueva, New Mexico, in 1984. The
originals were at a scale of 1:24,000, which are reduced here.
Overlapping photographs such as these can be viewed through a
stereoscope, resulting in a three dimensional view of the terrain to
be mapped.
| Top |
Field Survey
Information from field
surveys is necessary
to ensure the
accuracy of maps. |
Technology has reduced the requirement for
mapping work in the field. Gone are the days of planetable surveying
when the topographer sketched the map by hand. Nevertheless, the
field survey still plays an important role in making and revising
topographic maps. After aerial photographs are obtained, field
survey work may be required to establish and measure the map's basic
control points and to identify objects that need visual
verification.
Survey measurements are taken carefully to
establish the control points that become the framework on which map
detail is compiled. Two types of control points are needed to
position map features accurately. Horizontal control points identify
the latitude and longitude of selected features within the area
being mapped. They establish correct scale and map orientation and
allow accurate positioning of the map's features. Vertical control
points determine the elevation of selected points for the correct
placement of a topographic map's contours.
| Top |
Rigorous standards ensure USGS map accuracy
Markers such as
this are placed in the
field by USGS survey
teams to establish
control points for
maps. |
Because engineers, highway officials, land use
planners, and other professionals use USGS topographic maps as
tools, map accuracy is vital. Dependable maps are also important to
campers, hikers, and outdoorsmen.
The National Map Accuracy Standards were
developed to ensure that Federal Government maps meet the high
expectations and requirements of such users. Originally issued in
1941, the National Map Accuracy Standards apply to all Federal
agencies that produce maps. These standards require horizontal and
vertical map precision. For example, at least 90 percent of
horizontal points tested on a 7.5 minute, 1:24,000-scale map must be
accurate to within one-fiftieth of an inch on the map (40 feet on
the ground). Vertical testing requires that at least 90 percent of
the elevations tested must be accurate to within one-half the map's
contour interval. For example, on a map with a contour interval of
10 feet, tested points must be within 5 feet of the actual
elevation. These and other standards of accuracy and content ensure
consistency in both the detail and the appearance of maps. They also
ensure compatibility among USGS maps made at different times.
| Top |
What's in a Name?
Almost 2 million natural and manmade features
are identified in the USGS topographic map series. These geographic
names form a primary reference system essential for the
communication of cartographic information. Beyond map labeling,
geographic names are part of the Nation's living heritage. The
origins and meanings of geographic names, derived from many
languages, show national, personal, and social ingredients of life,
past and present.
Some of the oldest geographic names found on
U.S. maps are from Native American languages. Names like Adirondack,
Chippewa, Chesapeake, Shenandoah, Choctaw, Yukon, and the names of
28 States are derived from various Native American languages. Other
names reflect the European naming traditions of the early settlers.
New London, Yorktown, Grover Hill, and Lancaster are derived from
English; Fond du Lac, Baton Rouge, Marietta, La Salle, and St. Louis
are French; El Mirage, Guadalupe, Rio Grande, San Francisco, and De
Soto are Spanish names.
U. S. Geographic names are often rich in
description, local color, and national history. Names like Stone
Mountain, Ragged Ridge, Big Muddy River, Carmel-by-the-Sea,
Grandview, and Long Island paint descriptive pictures of the places,
features, and areas they represent. Last Chance, Hells Canyon,
Liberty, Thief Lake, Enterprise, Rattlesnake Creek, Dread and Terror
Ridge, and Paradise Flats evoke the dreams, fears, and color of the
frontier.
The standardization of geographic names in the
United States began late in the 19th century. The surge in mapping
and scientific activities after the Civil War left the accuracy and
spelling of a large number of names in doubt. This posed a serious
problem to mapmakers and scientists who require nonconflicting
nomenclature. The U.S. Board on Geographic Names was established in
1890 as the central authority to deal with naming conflicts. This
interagency body, chaired by the U.S. Department of the Interior,
helps standardize the spelling and application of geographic names
on maps and documents published by the U.S. Government.
| Top |
Verifying map features
Field personnel use aerial photographs to mark
and verify map features. A field check is necessary because
information on an aerial photograph can often be ambiguous. For
example, a worker in the field can indicate the difference between a
perennial stream and one that dries up at certain times of the year.
This is necessary because a perennial stream would be marked with a
solid line on a map while an intermittent stream is designated by
either a dash-dot or lighter weight solid line on a map. People who
know the local area well, such as fishermen or farmers, are
excellent sources of such information.
Another important job in the field is the
verification of place names and political boundaries. This work
often requires looking at courthouse records and talking to local
residents. It can even include a visit to the local cemetery to
check the spelling of a feature that has been named after a person
buried there.
Significant changes in map content
on successive editions of a map of Key Largo, Florida, illustrate
why maps need revision.
| Top |
Compiling the map
Upon completion of the field survey, the map
manuscript is compiled using stereoscopic plotting instruments.
Overlapping aerial photographs are placed in a special projector
connected to a separate tracing table. The projected photographs are
viewed through an optical system that causes the left eye to see one
photograph and the right eye to see another. The result is a
three-dimensional impression of the terrain.
Map features and contour lines are traced as
they appear in the stereo model. As the operator moves a reference
mark, the tracing is transmitted to the tracing table, producing the
map manuscript.
| Top |
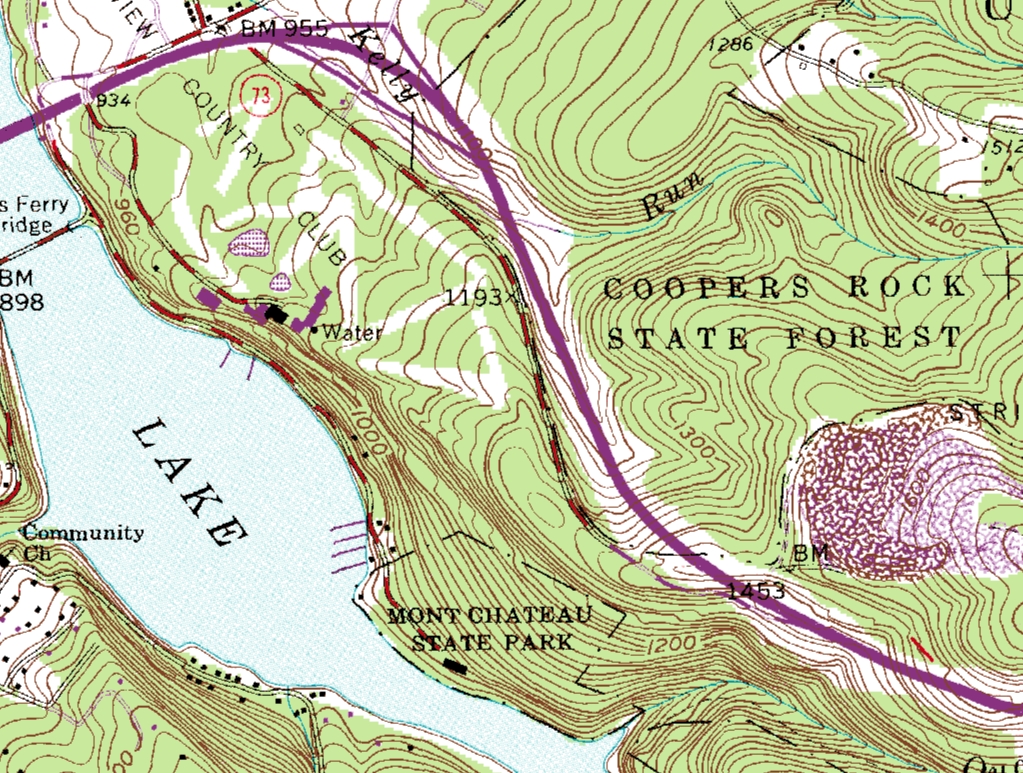
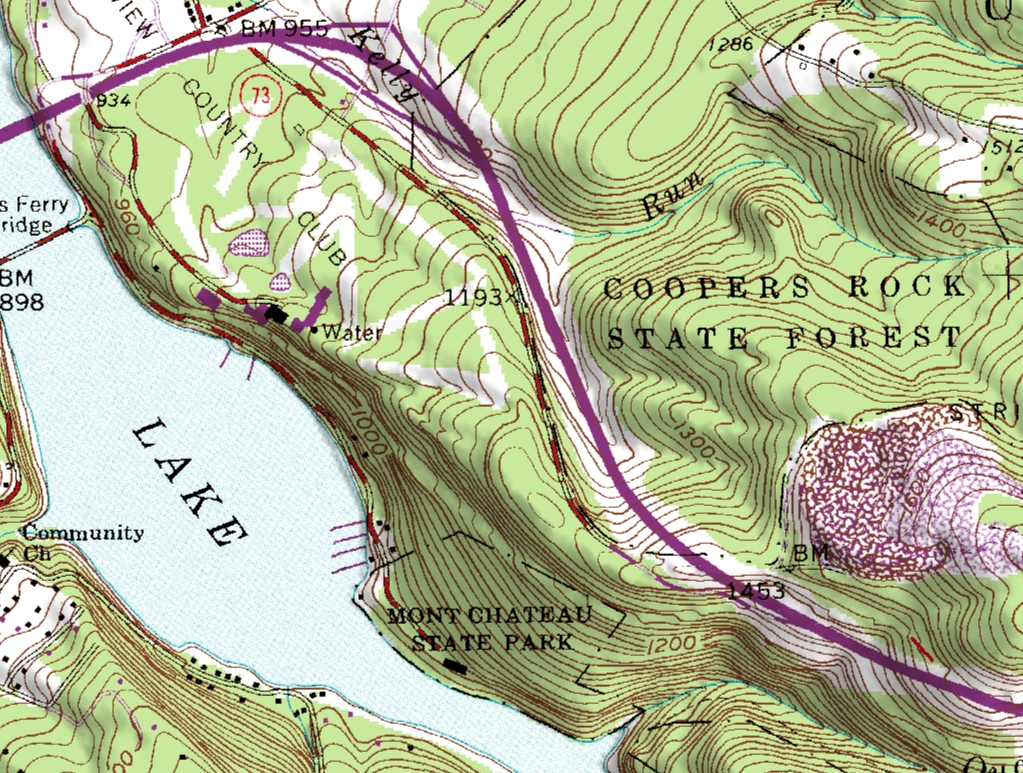
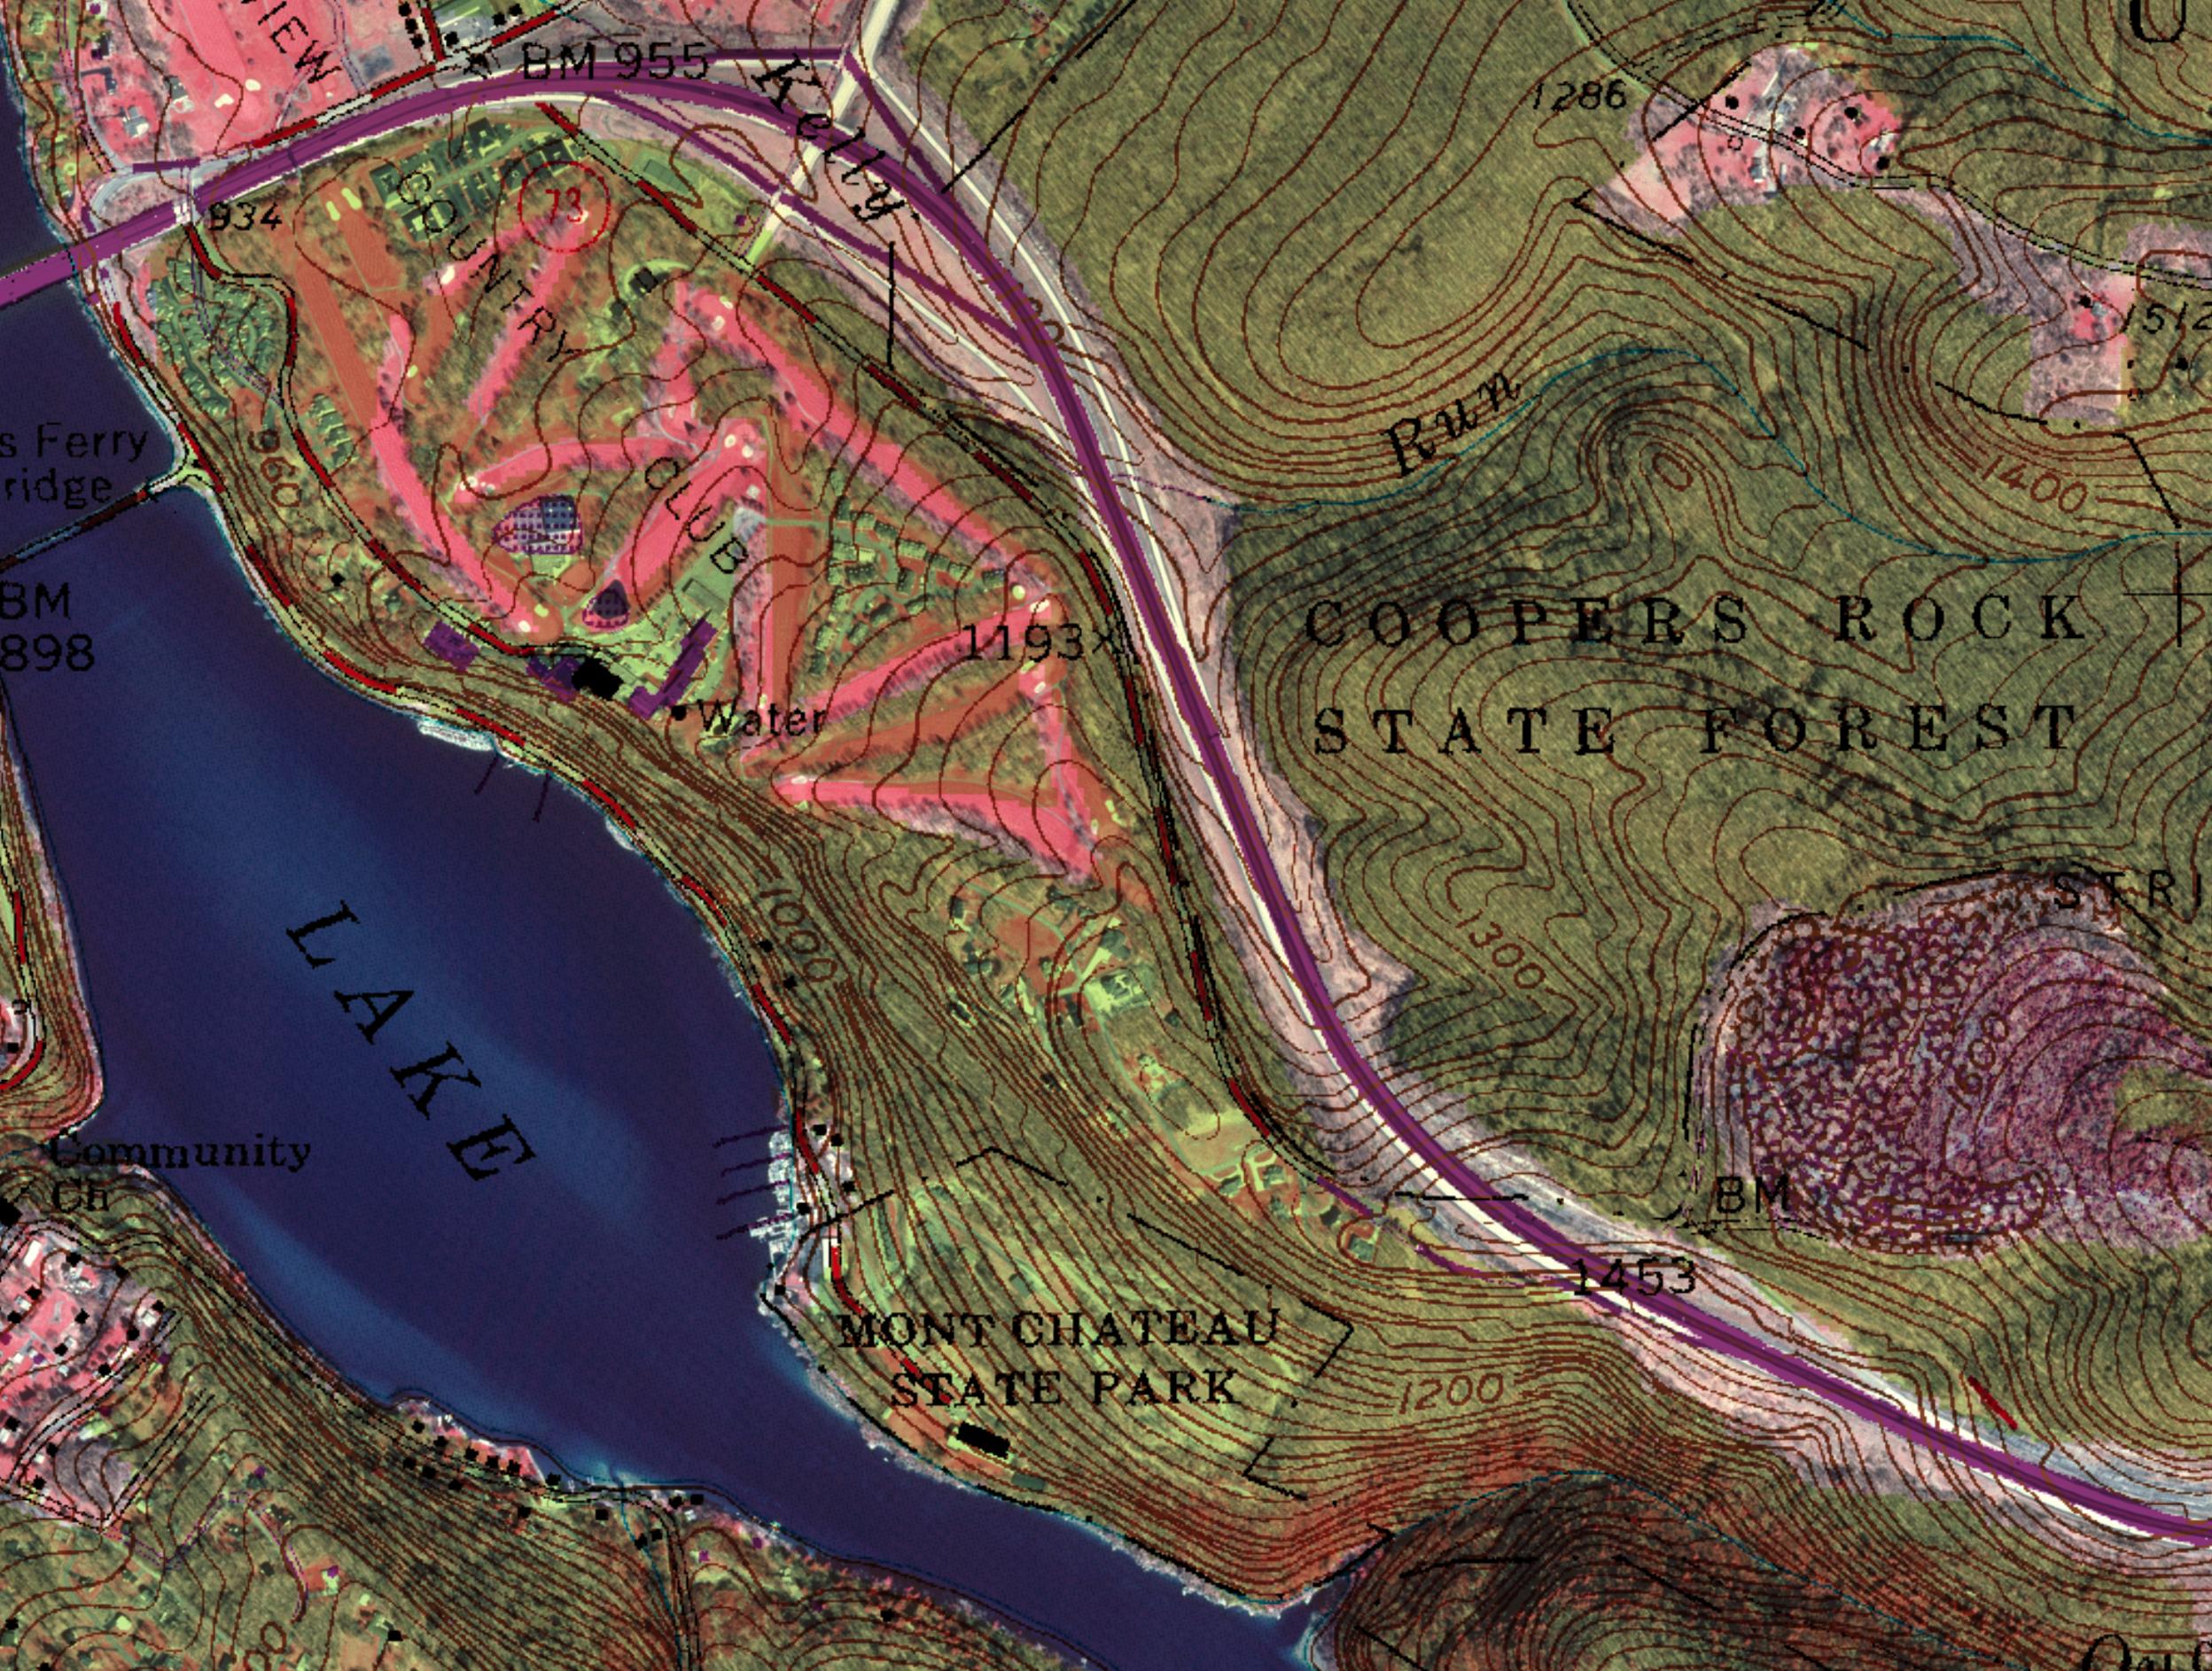
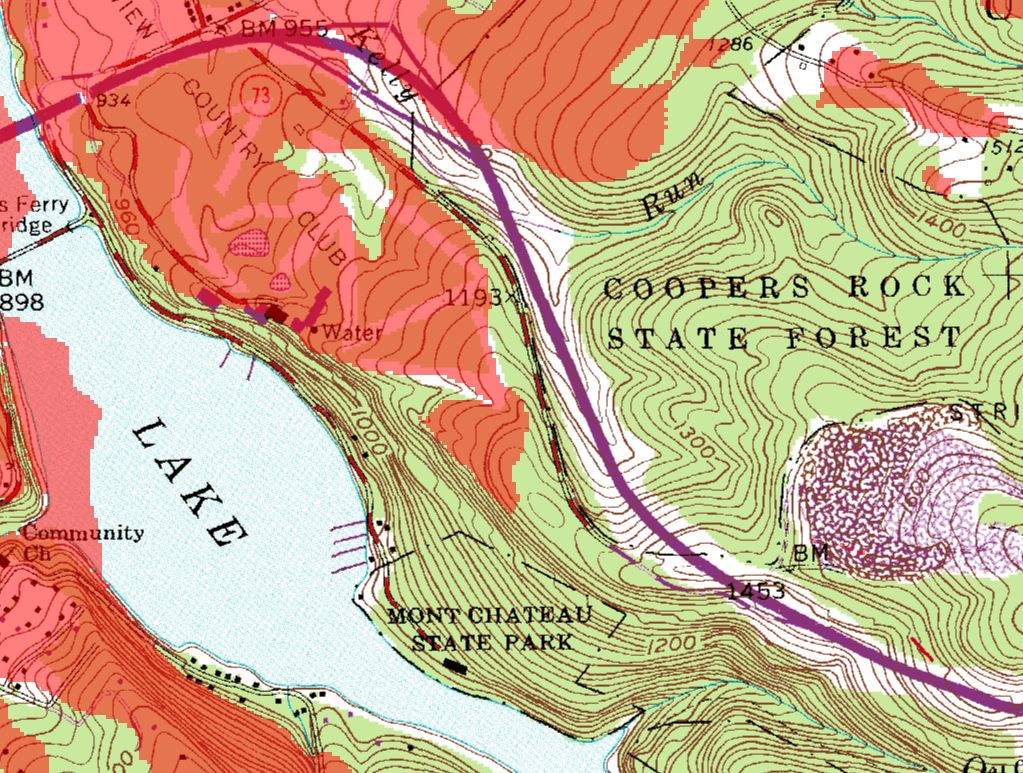
Map Separates
These illustrations show a
portion of a USGS topographic map (top left) and three of the six
colors used to print separate features. The green layer shows areas
of woodland, and the brown layer shows topographic features,
including contour lines. The purple layer shows features that are
added from aerial photographs and other sources, but are not field
checked.
| Top |
Map scribing, editing, and printing
After the map manuscript is compiled, several
steps remain before a map is completed. First, a map-size film
negative of the compiled manuscript is made. This negative is then
photo chemically reproduced on several thin plastic sheets to which
a soft translucent coating (called scribecoat) has been applied.
These serve as guides for scribing.
Working over a light table, the scriber then
uses engraving instruments to etch the map's lines and symbols. This
is done by removing the soft coating from the hard plastic guide
sheet. All features to be printed in the same color on the map--such
as blue for water features--are etched onto separate sheets. A map
is edited several times before final scribed sheets are completed.
Type for the words on the map is selected
according to standards that will ensure consistency of type sizes
and styles from map to map. Type placement is important for map
legibility, so type must be carefully positioned on clear plastic
sheets that are overlaid on the scribed separations. Photographic
negatives are made of the type for printing.
Printing plates are prepared for
each separate color from scribed sheets, open widow negatives
(above), and type sheets.
The final step before printing is the
preparation of a color proof. Multiple exposures are made of the
type negatives and scribed sheets. The result looks very much like a
finished map. Careful editing takes place for content, legibility,
accuracy, and spelling. When the final proof is approved, the map is
ready for printing.
A press plate is made for each map color by
exposing the appropriate scribed sheets and type negatives. Printing
is done by repeated runs of the map paper through the lithographic
printing press (one for each color), or one run through a press
capable of printing several colors in sequence. The largest USGS
press prints up to five colors of ink on a single pass.
Most of today's topographic maps were made
using these techniques, but computer technology will profoundly
influence the craft of mapmaking. For example, map compilation and
revision will be performed from digital images. Color separates will
be plotted from digital data rather than manually scribed separates.
Even the type for words on the map will be positioned and plotted
from digital data.
Portion of Fort Smith, Arkansas,
7.5-minute quadrangle map made to current USGS standards for
content, accuracy, symbols, and type.
| Top |
The Digital Mapping Revolution
Computer technology will not only change the
way maps are made but how they are used.
Computer-assisted map production is making it
easier to produce new paper maps and to revise existing ones. The
USGS is responding with innovative ways of compiling map data and
using them for map production. Many of the mapmaking processes
described above are being changed or eliminated. Improved
efficiencies in most facets of production will shorten the 4 to 5
years it takes to produce a map by traditional methods.
Widespread acceptance of computers and related
technologies has accelerated the demand for mapping information in
computer-compatible form. Government agencies and private businesses
now require digital mapping information for their computer-based
systems.
The goal of the USGS is to stay in the
forefront of the technology that will modernize the production of
traditional maps while responding to the growing need for data in
digital form.
| Top | |
Digitizing data
Most of the USGS's
digital map data are collected
from existing topographic maps. The task is monumental.
Map digitization resembles the original map
scribing process in that it requires that each feature on each map
separate be located, classified, and traced. A map can have 10 or
more different layers--roads, contours, boundaries, surface cover,
and manmade features, for example--that require digitization. Maps
can be digitized by hand, tracing each map's lines with a cursor, or
automatically with scanners.
After digitizing, several editing operations
remain. For example, attribute codes must be added to identify what
each digitized line or symbol represents. A variety of other tasks
must be performed to ensure that information is complete and
correct, including matching features with adjoining files, matching
features relative to each other within the file, and controlling the
accuracy of attribute coding and positions.
| Top |
The National Digital Cartographic Data Base
The USGS is the principal agency developing
standards and coordinating other matters related to Federal digital
cartographic data. The National Digital Cartographic Data Base
(NDCDB) was established by the USGS to distribute digital data that
meet these standards for use in map production and in automated
systems.
NDCDB data provide a framework of reference
for other data about the Earth and its resources. The NDCDB data
consists of digital line graphs
(DLG) and digital elevation models
(DEM). DLG's are the digital representation of information
typically found on a topographic map (point locations, lines and
area outlines). DEM's are matrices of elevations for ground points
spaced at regular distances.
Nationwide DLG coverage is complete for
transportation and hydrographic features found on 1:100,000-scale
maps and for most information found on 1:2,000,000-scale maps. The
1:100,000-scale data served as the base for the Bureau of the Census
Topologically Integrated Geographically Encoded Reference files--the
digital representation of the Nation used in the 1990 census.
| Top |
Geographic information systems
Geographic information systems (GIS) are at
the forefront of the mapping revolution. A GIS makes it possible to
combine layers of digital data from different sources and to
manipulate and analyze how the different layers relate to each
other.
With a GIS, researchers can combine
geographically referenced data from the NDCDB and many other sources
and perform complex analyses that have not been possible before.
GIS's are being used in applications as varied as:
- Soil conservation.. The
Department of Agriculture is combining DLG information with
scanned photographs and field boundary data to report and analyze
soil use.
- Crime solving.. Police
investigators link police record systems with geographic
information to analyze crime patterns and help solve cases.
- Emergency response planning.
A GIS can be used to combine transportation and earth science
information to help plan emergency response to a natural disaster,
such as an earthquake. By merging information on the types of
roads, locations of fire stations, and locations of faults, the
anticipated response times of fire and rescue squads can be
calculated both under normal conditions and following
transportation blockages caused by an earthquake.
- Marketing. Merging sales
information with digital map data can help companies target
markets or present sales information in geographic terms.
Whether used in government, business,
military, or a host of other applications, a GIS provides the means
to examine relationships in ways never before possible.
Satellite images of San Mateo County, California,
have been combined in a computer with elevation data of the same
area to produce this perspective view.
| Top |
Where do we go from here?
With today's technology, it is possible to
generate personal maps on a home computer. In the near future,
traffic jams may be avoided with dashboard-mounted computer mapping
systems. Beyond that may lie interactive television where local news
or weather reports can be chosen by touching a map on the screen.
Digital techniques will continue to influence
mapmaking, enabling more rapid production of accurate, current maps.
Computers can also help us manipulate data derived from traditional
maps in increasingly sophisticated ways.
| Top |
This online edition contains full text from
the original publication obtained from The USGS. This document has
undergone official review and approval for publications established
by the National Mapping Division, U.S. Geological Survey. Some
figures have been modified, added or deleted to improve the
scientific visualization of information.
|